Questrade, My direct access discount broker.

Questrade Democratic Pricing - 1 cent per share, $4.95 min / $9.95 max

Thursday, October 13, 2016

Currency Index for US Dollar vs Canadian Dollar

My first post has little to do with any stock but a currency index.

I decided to look at the US dollar vs the Canadian dollar as I am going to be converting some cash for a trip in the spring and thought I might apply some good old chart analysis to see if I can time the conversion to my advantage.

This is the historical chart for the last 5 years for a general overview of the price action.


The overall trend has been up, obviously, with periods of congestion and dips with this year having the most pronounced. The last three years have seen a spike going into January/February. There aren't any particular gaps or huge moves, it is a currency pairing after all.

Zooming in on the last year and a half and the more important recent months demonstrate a particular pattern that I usually like to watch. The pennant. Typically it is a continuation pattern; if the preceding activity was downward and the pennant forms, it often resolves downward near the apex. The reverse is true for uptrending activity.

The horizontal line is a resistance established September and November last year and reaffirmed March of this year at $1.34.


Zooming in yet again shows how the initial tentative resistance lines were established and changed until the final top resistance held. In the first pennant pattern, the bottom line forms a mostly stable support as it is approached 5 times without breaking until mid August. At this point it becomes a line of resistance. Currently the first resistance line is holding again.


Due to this being timing for buying US dollars, I would plan on just buying the dips but will wait to see if the price breaks down particularly as the bid/ask spread on this is near 3.8 cents and will likely preclude being able to do any serious active trading so I'll just have to cost average my way into this exchange.

These charts are based on October 10th closing and it is the 13th today. The pattern is still holding but it is winding up and ready to snap.


Wednesday, October 12, 2016

Just because it happened once....

I've been away from my blogging for a while now, I'm not even sure how long it's been without looking. While I have been following the market and doing other research, blogging about it has not been a high priority. As I decide to get back to writing about various aspects of trading and things stock related, I thought I would share something that keeps me from losing it when trade ideas don't necessarily go my way.


Just because it happened once does not mean it will happen again.

Perhaps it happens two, three or a thousand times, it still does not mean that it will happen again.

Having said that, the fact that it has happened before gives us some sense of comfort in knowing that it could happen again.

We fall into a trap when we think that because it has happened a thousand times before, it must happen again.... this time.... particularly when I have money in the game.

While I don't believe that the market is completely random, I do know that it can certainly throw some curve balls that will leave me wondering what I missed.

Jeff.

Monday, December 2, 2013

TSLA two week trade setup

On November 19th TSLA set up nicely for a 13% OTM trade for a 105/100 spread for a 31 calendar day duration (December 21st expiry) which was a 17.6% return. I didn't track the trade to see if there was a benefit in closed it early for a partial profit.

Here is the post TSLA Trade Set up

Today there is another nice example of a short term high probability trade set up in TSLA.


The IV Rank is at 58, highish which is good. The weekly options are priced nicely to provide a decent spread trade return. The expiry is the December 13th and the setup is at a different strike as the 10 trade day has shown a 90% win rate with spreads that are set 8% OTM. While it might seem to be adding to the existing trade, it's not. I could go on about the chart set up at the low price that it might be set to head up and increase the odds in favour of the put spread, but with 90% historical success, I wouldn't bother.

8% OTM is around 115 so the 115/111 for a $4 strike spread for the most bang for the buck at $55 profit (ROR near 16%). As usual, for the purposes of analysis, I consider that I am just hitting the bid and ask prices to get filled, I could easily go for the mid price and grab a few more dollars but this skews the trade slightly against me for profit considerations.

Jeff.


Friday, November 22, 2013

P (Pandora) weekly spread trade setup

Yesterday the net credit on the 25/20 November 22 put credit spread was 40 cents if I just hit the bid and asks, I could probably get slightly better by going for the mid price which would be 50 cents. With options that are trading in penny spreads the mid price would be 41 cents. I also might have got a bit better a day or two ago.

Yesterday, with options expiry today, the same credit spread last traded for 13 cents which is a 27 cent profit (67.5% of the expected profit). If it wasn't expiring today I might have chosen to close the trade out but in this case I can make 100% of the expected profit just by waiting a day and incur no commission costs. The price would have to move over 17% down to cause the trade to lose enough to only break even.

Today the price is up so the play panned out.

The IV rank is now up to 85 so I will be looking at the next week's options if the price drops enough to bring the option pricing high enough to get another spread trade. I am not comfortable enough to consider going to December options without a substantial move down in the price first.

I try not to speculate on where something like this might go, but it's hard not to... so here goes.... assume that there is at least one trade setup available per week. With a little homework that is not too much of a stretch.

With the weekly option trades that set up like this the returns are quite robust. This trade was an 11.1% return on capital risked over three days. Extrapolating that out to an annualized return as if it were a 7 day trade (this can be done once per week as there is usually something setting up somewhere to turn this out weekly) results in over a 500% annual simple return based on the capital risked. That's 360 into over $2,000 in a year without adding more positions than just one contract.

Playing with the numbers for a moment and assuming that the trade are all successful, which, given the setup and odds is possible (with a 10% lower strike and a 5 trading day duration the odds brush 90% successful) . The starting $360 making a $40 profit per week would double in 9 weeks, Adding this $720 as the new total risk and turning out $80 per week and repeating this every 9 weeks yields $10,800 in just less than a year, or 3100%. Of course this ignores commissions, possible losses and draw downs and a lot of reality.

I wouldn't recommend using all the profits in the next trades on the same underlying stock as that amounts to gambling as the entire capital is at risk on the first day after doubling the position size. A better way to increase the profit is to widen the spread from $5 to $6 to bump the profit amount or set up other simultaneous trades in other options. More smaller trades are better than less larger ones.

Jeff.

Wednesday, November 20, 2013

P (Pandora) possible trade setup using the S&P500 Simplified Formula

I was looking at other possible trade setups last evening and noticed that P (Pandora Media) was brushing the 60 IV rank which in the neighbourhood of being ripe for a put credit spread, so I thought I would run the numbers to see if it was ripe.

Two primary criteria for even considering a stock include being very liquid (high volume, over 2 million) in both the stock and option volume. Options I like to see 500 open interest or more in the strike ranges where I might choose to place a trade. I also like to see penny spread pricing (difference between the bid and ask) but up to 10 cents is not the end of the world, getting orders filled may take longer if I am picky about the price in those cases.

P fits the bill although the option spread is 5 to 10 cents.

The next thing to do is to run the historical price activity through the wringer.


40 Days35 Days30 Days25 Days20 Days15 Days10 Days5 DaysCombined
StrikeWin RateWin RateWin RateWin RateWin RateWin RateWin RateWin RateWin Rate
0%62.96%62.96%62.96%59.26%53.57%53.57%57.14%57.14%58.64%
-1%66.67%62.96%62.96%59.26%53.57%60.71%60.71%57.14%60.45%
-2%66.67%62.96%62.96%59.26%60.71%60.71%60.71%67.86%62.73%
-3%66.67%62.96%62.96%62.96%60.71%60.71%60.71%75.00%64.09%
-4%66.67%62.96%62.96%62.96%64.29%60.71%60.71%75.00%64.55%
-5%66.67%66.67%62.96%62.96%64.29%60.71%67.86%78.57%66.36%
-6%74.07%66.67%62.96%66.67%67.86%64.29%67.86%82.14%69.09%
-7%74.07%66.67%62.96%70.37%67.86%64.29%71.43%82.14%70.00%
-8%74.07%66.67%66.67%70.37%67.86%64.29%75.00%82.14%70.91%
-9%74.07%66.67%66.67%70.37%67.86%64.29%75.00%82.14%70.91%
-10%74.07%66.67%66.67%70.37%67.86%67.86%75.00%89.29%72.27%
-11%74.07%66.67%66.67%70.37%67.86%71.43%75.00%92.86%73.18%
-12%74.07%66.67%66.67%70.37%71.43%71.43%78.57%92.86%74.09%
-13%74.07%70.37%66.67%70.37%71.43%71.43%82.14%92.86%75.00%
-14%74.07%70.37%66.67%70.37%71.43%71.43%85.71%92.86%75.45%
-15%74.07%70.37%66.67%70.37%71.43%75.00%85.71%96.43%76.36%
-16%77.78%70.37%70.37%70.37%71.43%78.57%85.71%96.43%77.73%
-17%77.78%70.37%70.37%70.37%71.43%78.57%85.71%96.43%77.73%
-18%81.48%77.78%74.07%70.37%71.43%82.14%85.71%96.43%80.00%
-19%81.48%77.78%77.78%70.37%75.00%82.14%85.71%96.43%80.91%
-20%85.19%77.78%77.78%77.78%82.14%89.29%85.71%96.43%84.09%
-21%85.19%77.78%77.78%81.48%85.71%89.29%85.71%96.43%85.00%

Well, not as good as I might have wanted as only the really short term trades are in any decent range. Seeing as this stock has weekly options I would look at the near week to see if there was any premium to sell in that 5 day area so with that in mind I looked at the November 22 options. These are actually the monthly options but in the last week, it amounts to the same thing and probably allows for higher open interest.

Quick note about this, if I already had a longer trade on I can add a different strike short term trade which serves to add a sort of diversification to the position and add a bit of profit or, if the current position is being tested (close to losing) it can also serve to offset some potential losses... tough to do that with a straight stock trade.

With the price today at $28.59, 11% lower would be $25.44... so I selected the 25/20 November 22 strikes to come up with a 40 cent credit. While the ROR is only 7.1%, that is for a trade that will only last three days, which is a very good daily return of 2.4%. I think that this would be one to keep an eye just for the weekly option trades, almost scalps in a sense as they are so short of duration.

The other option is to look at the longer term expiry options, out to 30 trading days or so, but the idea would be to only hold them for a shorter term, 10, 15 and 20 trading days, rather than through to expiry. This amounts to early profit taking. Here's a table showing the historical results:


-->

10 of 40 days15 of 40 days20 of 40 days10 of 30 days15 of 30 days20 of 30 days
StrikeWin RateWin RateWin RateWin RateWin RateWin Rate
0.00%55.56%59.26%62.96%48.15%51.85%55.56%
-1.00%59.26%59.26%66.67%51.85%55.56%55.56%
-2.00%66.67%59.26%66.67%55.56%55.56%59.26%
-3.00%70.37%59.26%66.67%55.56%59.26%59.26%
-4.00%70.37%62.96%66.67%59.26%66.67%62.96%
-5.00%70.37%62.96%66.67%66.67%70.37%62.96%
-6.00%70.37%66.67%66.67%66.67%74.07%66.67%
-7.00%74.07%66.67%66.67%70.37%74.07%70.37%
-8.00%74.07%66.67%70.37%70.37%77.78%70.37%
-9.00%74.07%70.37%70.37%74.07%81.48%70.37%
-10.00%74.07%70.37%74.07%81.48%81.48%81.48%
-11.00%74.07%70.37%74.07%81.48%81.48%81.48%
-12.00%74.07%74.07%77.78%92.59%85.19%81.48%
-13.00%77.78%74.07%77.78%92.59%88.89%81.48%
-14.00%77.78%77.78%77.78%96.30%88.89%81.48%
-15.00%81.48%81.48%81.48%96.30%88.89%81.48%
-16.00%85.19%85.19%81.48%96.30%88.89%85.19%
-17.00%88.89%88.89%81.48%96.30%88.89%85.19%
-18.00%88.89%92.59%81.48%96.30%88.89%85.19%
-19.00%88.89%92.59%81.48%96.30%92.59%85.19%
-20.00%92.59%92.59%92.59%96.30%92.59%85.19%
-21.00%96.30%92.59%96.30%96.30%92.59%88.89%

The table represents trades that were placed a certain percentage lower than the trading price at the time 40 days and 30 days from expiry and shows how low the price was relative to the starting price at 10, 15 and 20 days later. The first 10 days of a 30 day to expiry period seems to be the sweet spot as in over 92% of the trades the price remains higher than the 12% lower strike and almost 67% of the time it remained higher than the 5% lower strike.

The downside is that the premium would have to be priced very high, perhaps from a very high IV ranking in order to see it drop fast enough after the trade was placed to be able to close the trade for a profit. This sort of trade relies on the fast collapse of volatility and is riskier than I would take right now... the IV rank of 60 is not high enough and the actual price action is not low enough.


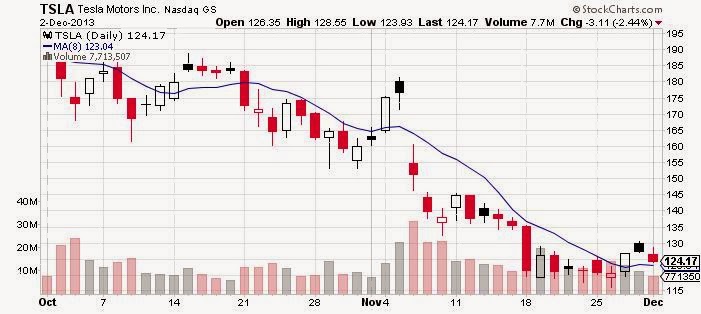
On the chart, the blue line is the 8 day moving average and I like to use it as a go / no go indicator as the price rides below it for at least a day or two before entering a trade. Typically there is a spike in premium at this time and entering at a lower price allows a greater margin from the average price for the trade. This follows a rough mean reversion idea and I can get into standard deviations, but won't at this point.

All of my tables assume that EVERY trade is entered regardless and while the lower entry idea results in somewhat better historical numbers it eliminates a lot of the possible profitable trades.

Jeff.

Tuesday, November 19, 2013

S&P500 Simplified : Historical Odds Are....

In order to prove the efficacy of a plan, some historical context needs to be established... as much as historical performance does not indicate future performance, it is a very good indicator that a plan may have some merit going forward.

Using SPY as the initial test subject and about 10 years of daily open and close prices I set up a spreadsheet to compare various trade periods and strike ranges against the actual price movements. I also ran the numbers for 20 years and trades using every single trading day and the percentages were very close so I have chosen to work with a smaller chunk.

In this first study I used trade periods of between 5 and 40 trading days (not calendar days) and calculated the price move of SPY for each period ending on the option expiry, the third Friday of the month. The October 2013 monthly option expiry was the 18th, so trade start dates would have been August 22, 29th, September 6th, 13th, 20th, 27th, October 4th and 11th.

The percentage price move between the start and end of each period was calculated and compared to various strike distances represented as a percentage lower than the opening start price. I know the resultant "strikes" are not accurate to the dollar so this is more a relative measure to prove a point. If the price move did not end lower than the selected percentage or strike on expiry day, it was considered a successful trade.

Here is the resultant table. The colours represent the success rates up to 80% in red, between 80% and 85% in orange, 85% to 90% in yellow and anything over 90% in green. I figured that anything over 97% or 98% is just the narrow edge of the bell curve and not worth figuring out.

40 Days35 Days30 Days25 Days20 Days15 Days10 Days5 DaysCombined
StrikeWin RateWin RateWin RateWin RateWin RateWin RateWin RateWin RateWin Rate
0%65.52%61.21%60.68%59.83%60.68%63.25%58.97%56.78%60.86%
-1%69.83%68.10%66.67%67.52%68.38%68.38%66.67%74.58%68.77%
-2%73.28%71.55%73.50%72.65%73.50%76.92%74.36%83.05%74.87%
-3%78.45%77.59%78.63%77.78%80.34%82.05%82.05%89.83%80.86%
-4%82.76%82.76%82.05%81.20%83.76%90.60%91.45%93.22%85.99%
-5%87.93%87.07%85.47%85.47%88.03%93.16%92.31%95.76%89.41%
-6%88.79%87.93%89.74%89.74%91.45%93.16%94.87%97.46%91.66%
-7%91.38%90.52%93.16%94.87%96.58%94.02%96.58%99.15%94.55%
-8%93.97%93.10%94.02%94.87%96.58%94.87%98.29%99.15%95.61%
-9%95.69%93.97%95.73%94.87%96.58%94.87%98.29%99.15%96.15%
-10%95.69%95.69%96.58%96.58%98.29%95.73%98.29%99.15%97.01%
-11%95.69%96.55%97.44%96.58%98.29%96.58%98.29%99.15%97.33%
-12%97.41%97.41%97.44%96.58%98.29%97.44%98.29%100.00%97.86%
-13%98.28%97.41%97.44%97.44%98.29%98.29%98.29%100.00%98.18%
-14%98.28%97.41%97.44%98.29%98.29%98.29%99.15%100.00%98.40%
-15%98.28%98.28%97.44%99.15%98.29%98.29%99.15%100.00%98.61%

It is worth noting that all periods hit the 90% range at -7% below the starting price and -4% for anything 15 days or less.

Assuming that there are trades at those 90% plus ranges, I like the odds.

Jeff.