Questrade, My direct access discount broker.

Questrade Democratic Pricing - 1 cent per share, $4.95 min / $9.95 max

Sunday, May 31, 2009

S&P500 relative volume chart

I was looking for the best method to have the S&P 500 volume show up on a chart and I stumbled upon an unusual looking chart that may have some significance.

First, the S&P500 is an index and does not have any volume related directly to the value of the index, it is only a number representative of the group of stocks and their combined value. So I would expect that the volume would be representative of the combined volume of the underlying stocks. Well, the exchange does not send that information with it's feed to the various data processors, like Esignal, stockcharts.com etc. They have to generate this number themselves.

There is an index that I found, $TVOL, which is the total volume of the NYSE. This is not the S&P500 but I think it will be representative of the overall market sentiment.

I found a formula to let me plot this in the lower volume pane of the chart the same as any other volume on a regular equity chart with a moving average, which may be helpful as well. I am not certain yet how this may work on an intraday scale yet.

I have been thinking of trying to track volume at certain times of day to see if the current day is trading higher or lower volume than the same time over the past days. I had not got around to trying to chart this as I was not aware of TVOL yet and thought I would have to come up with my own cumulative market volume indicator, not an easy task.

Which leads me to my interesting chart. I plotted the $TVOL as the primary data on a chart and set it to an hourly chart and this was the result:


Each bar represents one hour, although the first bar is really only 0930h to 1000h as it is set for 0900h-1000h. Worth noting is the last bar as this one is for 1600h - 1700h. Quite a large volume traded after hours, far more than average.

Here is the same chart in a 30 minute period for the last few weeks:
I need to setup a formula to change the colours for each half hour so they are easier to distinguish...but I will only do that if there is any validity or use to the relative time period volume. I think that it will help to differentiate a trending vs ranging day as a high volume start could likely indicate a better moving day...or just a nasty whippy day.

I'll check that out historically a bit then watch it for the next week and see how it correlates. Given the big volume afterhours on Friday I might expect a big day on Monday.

Jeff.

Friday, May 29, 2009

May 29th...small day

I did some trading today....I am finding that "trading" does not equate to placing trades as much as studying the market activity and getting a feel for where the trades are.

This was a funny day and I only placed one trade, made a few bucks as I caught a 20cent move in SDS as the S&P came off of the midweek high. I think that I am trying to hold onto my profits from yesterday too tightly. Get a little cash and I don't want to part with it so I was watching for perfect setups to enter...that led me to miss some nice trades, I tracked a 25cent trade in SSO and I see a couple of others since. Having said that it is a strange Friday as volume was down, end of the month so I don't regret not being active.

I did work on my audible alert system for Esignal. I now can set a fast and slow SMA to alert me with one sound as the fast crosses upward and another as it crosses downward. I plan on using the 10 SMA for a pre-alert, the 15 SMA as the setup and the 30 as the slow SMA all in the TICK data. The next pullback (or rally) into the opposing 100/195 high low average band will be the trigger, no alert and I would like to get this setup to place the arrows for each step. I actually missed a nice trade due to dinking with the arrow on the TICK chart instead of just watching the activity.

I noticed a strange pattern in the TICK data candles today, one that I have noted on other days also. The candles are sparse and there is not much "beef" as the TICK swings from one range to another. Higher volatility usually accompanies this along with fairly tight ranging and less predictable price activity. I plan on going back and determining what the circumstances are but I think that it will have to do with volume and expectations coming off of a certain types of preceding days.

Interestingly this was typical of the TSX and the related TICK data. It looked very similar and I recall it not being a very good indicator.

I don't have charts to illustrate this right now but I wanted to make a note of it.

Jeff.

Thursday, May 28, 2009

That's more like it.

I just applied my TICK trading rigorously on the initial move on the S&P500 this morning. The action looks to be muted for a while as everyone takes a breather, consolidates, covers and what-not so I figured I would post the "one good trade" of the day. If I really trusted my entries I would be in SSO right now as the TICK says that it is heading back up...perhaps the pivot point is the new target for a reversion trade...I will sit on my profits for now rather than taking a slow trade that I don't completely trust.

TICK:

Note the declining TICK highs even though the SPX is not moving all that much this is like setting a spring and just winding it up until it gets let loose. I used the trigger (black arrow) but jumped it a bit as I would like to see it hit or pass the upper range, I went with the position of price on the chart as well and it was just testing the 50 sma and the pivot point a bit, looked like a good technical entry anyway.

SDS:

Nice entry at $58.80. I kept the sto rather steep as I figured this may be a short lived momentum style trade, glad I did as I exited at $60.12 for a $1.32 gain.

I see that I should have trusted my reversion indication as the SPX did indeed head back up after this quick sell off. I will wait and watch for a setup once everything gets near the pivot point again though. Perhaps I will not trade anymore as I might expect a range day forming until mid afternoon. I need to study more before trying range days again as I do not do very well in them, I don't think I trust my judgement yet.

Jeff.

May 27th chart followup

Here are the charts for yesterday's setups:

TICK:


SDS:

I started marking these as if I took every indicated trade based solely on the TICK, just for kicks, to see where that might have led. The terribly obvious resistance at yesterday's high could not be ignored as any trades to the upside of this line were doomed, I know as I tried one or two and they went nowhere. So this puts a short bias on any trades and I only posted the lead up to the large drop in the S&P500, everything before that was just tight range trading. The price chart is for SDS, the leveraged bear ETF

Interestingly this could have been played without the TICK altogether due to the solid resistance by just entering short as close to this line as possible...or even a bit over. There are far more ways to determine trade entries...I just like the way the TICK shows me what is going on.

The green arrows are the first indication of the following move and the black are the triggers to make the trade. Given the expectation of the move either of those two trades would have stop loss orders below the black low for SDS from Tuesday (which corresponds to the SPX high). Moving the stop up following the 50sma or the purple 100VWMA ( I am starting to recognize it as a decent stop setting once a move is underway).

Should I have been stopped out on the 50sma after 1430h there was another nice setup after 1500h to get back in for more of the move.

Jeff.

Wednesday, May 27, 2009

May 27th, little AM trading.

No time to do up charts today so just a synopsis.

I did make three trades. The first two were plays following the TICK as a straight trend indicator, which did not work as there was no trend, just a tight range so I was stopped out both times for small losses...most of my losses are smal at least.

The third was a TICK trade but I waited until the price broke yesterday's high then pulled back for a test. This already happened earlier and failed so I was really playing a long shot that it would not fail... long shots are not really the best moves. I headed out after that and now see that the afternoon had a nice selloff.

According to the TICK data it started at about 1230h and the best next entry short would have been at 1242h, 1248h or 1303h. Others were at 1314h and 1318h and one late one at 1324h.

Checking SDS for price entries at those times all closed from $57.27 to $57.39. The lowest low at any time over that period was $57.22. My stop for SDS to start is usually 15 - 20 cents. In this case somewhere under $57.18 as that was yesterday's high, nice resistance level for SDS that never broke again.

So, had I been in front of the screen would I have traded this one? I think so as the signal was pretty blatant and repetitive.

I'll check the charts closer tomorrow ans see how it would have faired as a trade, how much I may have captured given my regular stop settings and what not.

Jeff.

Tuesday, May 26, 2009

May 26th running commentary

I anticipated a down day today in the S&P500...for no other reason than I figured that I should pick a direction. Seeing as the pre-market was mostly below Friday's range I figured it was an OK shot...but not worth trading solely on that premise. As it turns out I was wrong...a day when being able to change trading plans on the fly and not getting stuck into being "right" are important.

By 1000h the SSO, SPY etc hit the pivot point at $24.53 and never slowed down until past the R2. I am determined to only play the TICK setups that I now know to be high probability setups but I was not on the ball this morning (phone calls for most of the AM) so I did not get in until later on.

Check the overlayed chart with the SPX in black followed by financials, technology, health care and energy. I have another that includes some other important sector ETFs but I can only fit five on one chart so I run two charts with the SPX as a reference between the two. It looks OK. Today it was pretty obvious that everything was, more or less, in synch

Here is the TICK chart with the notated trade triggers in green arrows with the possible trade entries in the following black arrows:

Here is the SSO chart with the corresponding trades noted. I only marked the first actual trade entry for each trigger. Note that trade 2 was the only one that I got into today due to AM phone calls and afternoon appointments. Most of the others I tracked including the very first one.


I ended up getting stopped out, I didn't notice the 100VWMA (purple) coming up to the price level, I should pay attention to this as it seems to be a fairly relevant support line often. Seeing as I was quite late getting in I tried to keep a tight stop loss using recent resistance...I made a few bucks but there was more potential left in the move.

Once I get more confidence in my trades in this market using this style I will feel better about letting the stop ride longer. This move did take a long time to get going though so I suppose it wasn't so bad to be out. Long consolidations tend to be unpredictable...for me, so far, at least.

Hmmm...the TICK trigger trading looks simple but there is a lot more going on behind the scenes than I really think about anymore. If, for some unusual reason, this does not work out to be a tradeable system the whole point is moot. Although I expect it to work out nicely, once I get my rules in place and start applying them properly, it will not be quite as simple as "this does that then do this". There is the stop setting, which I have not nailed yet, the entry timing, the market movement mode (trending, ranging etc) and some other stuff that seems "common sense" now but in some way affects the trade management.

Oh well...likely not much trading tomorrow, off to see some distributors and clients in the city. Maybe one or two morning trades if I can manage to squeeze them in AND they setup perfectly for me.

Jeff.

Friday, May 22, 2009

Tight range day, May 22

The first pre-market entry in my journal outlined my expectations of the market as follows:

"watch SSO from $24.60 as support and $24.90 as resistance"

The second entry states that "I expect today to be a watch and see day as I tinker...". I even told myself not to trade today. Friday (old no trade on Friday rule that I always break) and more so a Friday before a long weekend in the market.

SSO opened at $24.65, a penny off of yesterday's open, dropped to $24.33, reached a high of $24.90 and has wallowed around between the two numbers all day.

I tried a few trades, 3 of the six that I tracked. My first exited rather ungracefully as I got almost 10 cents less than my stop. All were nice setups but were all too close to the numbers to be really good trades in any event though.

The high low TICK moving averages basically span evenly either side of zero, good indication of a flat market and a good market to stay away from for index trading unless trading higher volume scalping.

Make that four trades. SSO broke the $24.90 mark and returned for a test, TICK seemed to substantiate the "test" so I got in at $24.91...for a stop out at $24.83... basically at the price I figured if it hit it was not likely to stop. Should have been playing the envelope after all as SDS made a better than 50 cent move at the same time.

Interesting to note that the open and high for the SPX does not correspond at all with the SPY or SSO, relative to their prices. I expect that this is normal. Too bad that Esignal does not give volume for the SPX, just the ETFs.

I look forward to trading next week as I expect to be able to see a trend day or two to test out my TICK trading on.

Jeff.

TICK timing gets complicated

In an effort to simplify the trade decisions based on the TICK values the chart gets more complicated. This is typical of trying to find something that is "fool proof".

I added moving averages of the high and low values a while ago. I started with the 390 minute (1 trading day) and now added 195 minute (1/2 a trading day) to get an average range of the TICK values. I am toying with the 100 minute now but I think it is too short for my purpose. Ideally the period should match the average duration of an intraday trend, so I figured that a decent trend is about 1/2 a day long.

I had Bollinger Bands on for a while but did not find them very useful in any consistent manner. The moving average high low band gives a range that seems to be reasonable. As the 15 crosses the 30, say on the way up, I start watching for an entry. Using the 195 band I wait for a low spike through the low band and, if the chart does not contradict this move, place a trade.

More generally the bands can act as a trend indicator. As the MA cascade nudges one side of the range it is time to start watching for a reversal or consolidation. The idea here is that I might already be in a trade from the other direction and this would lead to a tightening of the stop or an exit, depending on a number of chart and market factors. Determining whether the market will likely trend, or even the direction of the first major move would be a bonus in that this system would act as a confirmation of that call. Of course, if I could make that call consistantly I would not need to bother with this whole TICK notion.

As much as I would love a mechanical system to be able to crank out trades and profit I don't see that happening here. There will always be a factor of market analysis, chart reading and discretionary trading involved that would be far to complicated to actually try to program. The best I could hope for is some method of alerting that a decent setup is setting up.

Market is about to open. Friday before the long weekend should prove a slow market as volume is probably going to be light. If the spread is 2 cents or more on a regular basis I will likely leave trading until next week and concentrate on studying today.

Jeff.

Thursday, May 21, 2009

One good trade from yesterday, May 20th

I had more than one good trade but this one was the one I liked the best as I learned more from the leading trades to get to this one.

Overall I had 9 trades, 4 profitable, 5 losers. Small profits left me down for the day after commissions.

While the chart is SSO, trade one was made in SDS expecting the 200sma to act as resistance in SPX, SPY and SSO. I have the sector chart with the various sector ETF overlays and should have noted that they were wallowing in unison. Rather than playing the 200 I should have been fading from yesterday's high and the pivot (narrow blue line)low ranges. I stopped out quickly.

Trade two was a reversal play from the first, figuring that I must have been wrong the first time. I know better than to jump into a trade based on the last trade, I need to see something in the charts to justify it. I now see a few things to counter my trade, sector reversals, recent ranging...this is one of those times to wait for the trade to come to me. So I gave up and set an alert for a few cents over the pivot and a few cents under the yesterday's high and ignored the charts.


Upon hearing the alert telling me that the price has dropped to the pivot I checked the TICK and saw the nice downtrend. I waited for a TICK bar to coincide with a test of the pivot from below and entered SDS.

I had 45 minutes of waiting for this point ( I was doing other stuff though) and entered a classic breaking move. My only downfall on this trade was that I was hungry for a profit so I kept my stops tight. Although I think that would not have done any different as it was in the last hour and this time can be very volatile...best to stop tight anyway. Had I some profits to play with already I may have felt inclined to leave it some breathing room as all my indicators pointed to move of a downmove in SPX.

It is worth noting on the TICK the last spike above the red +800 line that coincided with the rally just after 1530h. I saw that and seriously considered another trade but figured I was pushing my luck this late in the day. Everything still screamed "more down to come".

I may try something different today...no price charts for the ETF that I am trading...maybe I won't actually trade them either, we'll see on that one. Run the sector overlays, the TICK, and the sector quotes...make trade decisions based on those and perhaps check the price chart and make the trade IF the others indicate first. See what I see.

Jeff.

Wednesday, May 20, 2009

Timeline for a trading learning curve

I keep reading articles written by long time traders or training people that state that getting up to profitable consistent levels takes some time...as in years.

I find this interesting as I know that I am not consistently profitable even though I might have expected that I might be able to pull it off by now. I keep finding more and more to learn and more and more to get familiar with. Even if I get up to speed on a plan the market is likely to change on me and I would need to be flexible enough to be able to alter my plan to accommodate that shift without losing my shirt in the process.

Start small and increase position sizing in small amounts (although that is hard to do when trading even lots and starting with one, one more lot is a small amount but it is doubling risk right away).

Don't expect profits for months, get to a trading level of breaking even on trades and consider that a good starting point.

As a new trader I could easily be dissuaded from my path of attempting to get into trading seriously without some level of professional training...but I am too bull headed to give in so I persevere. Pro training is expensive enough to be a deterrent itself. Then again, at what point might it have been more cost effective to just take the training in the first place...but then there is no way to know which training outfits are worth the expense unless you have gotten wet in trading and have a feel for what style suites the best.

I'll keep plugging away at my plan.

Today was a very good learning experience. Even though I ended down I ended on a profitable trade that I setup in the late afternoon, waited for the trade to come to me, entered where I wanted and exited close to my target. That one was from a lesson in choppy market trading and breakouts that I knew before but now have more of a handle on some of the indications that a breakout is worthy of a trade. This after playing in the surf too long today though.

Charts in another post later perhaps.

Jeff.

Tuesday, May 19, 2009

Evening comments...

Well, more than just the day.

I am still in search of the trading style and method that are right for me and my style... or personality if you will. I have run a wide gambit of methods and strategies, almost all have been brain farts of my own mixed with some of what I have read along the way. At this point it is hard to tell the difference as I have read so much and tried so many things. Suffice it to say I am getting quite a lesson in variety.

I look at the latest strategy for day trading using the TICK as a primary tool along with pivot points, daily OHLC, monthly pivot points, moving averages, sector trends... and I am sure a few other tings. Each of these parts has been used to study price patterns in the various stocks and ETFs that I have played with in an effort to get familiar with each and how they interact with those that I already am reasonably familiar with.

Luckily, or perhaps unluckily, I have a bit of a passion for this sort of thing. Not only does it keep my mind working on interesting stuff but it has the potential to net some nice returns.

I am seeing some strong potential in this latest method. The absolute dollar returns possibility is not as great as some other strategies that I have formulated in the past, but I could not get comfortable enough with them to let them work to their full potential. I felt restless once I established that they could work and then tried tweaking until they would no longer work and moved on to something else.

This method feels more comfortable. I can drop in to trade at anytime during the day, see the established pattern and trade as much or as little as I like without having to see the open, follow every tick along the way. It does not look like a huge money maker off the bat, but that really has never been the point. I can up the position size if I so choose to increase the profits rather than having to work harder at making the trades work. Exits are by manually moved stops which leaves me the safety factor of being able to walk away from a trade if I need to and not have to be overly concerned that I may loose more than I already allowed for.

I may take a couple of day to let this soak in and get some other thing completed that I would like to before jumping into this with both feet. The volume in the market is dropping off apparently due to the pending long weekend so trading may not be quite as normal as it has been...although that might be the best time to try this particular strategy out.

The next step is seeing how this may be incorporated into a longer term strategy. I have some ideas but I have no idea if they are anywhere near realistic.

Jeff.

The day in TICK

Here is the trading day today, as mentioned, all fake traded, most live.

The first chart is the TICK chart that I use for trade entry. This is a larger window of the next chart as this shows a little more detail. The first two arrows are the first two trades of the morning, both in SDS to play the SPX short side.

Green lines represent the trade duration and stop times.
Moving averages are 15, 30, 45, 60 SMA.
Dotted black lines are 390 period moving averages of the high and low of the TICK extremes.


It is worth noting that the first trade could have happened in the minute prior to the arrow or in the following 2 or three minutes and the trade would still have been a decent trade...even a little later than that would have worked out, seeing as the second trade was 9 minutes later and only necessary due to a possible tight stop. In reality I am not certain that I would have kept the stop so wide though... I expect, being so early in the trading day that I would have been up another ten cents on the stop which would still have gotten me out in the same minute.

Here is the day in TICK, up to the second last trade:

This is SSO and the trades made using the TICK entry.

Following is the SDS chart for the trades as well.

It is worth noting that I tried a chart entry early in the day and compared it to a TICK triggered entry. I entered SDS for a 15 cent loss and two minutes later, waiting for the TICK to set up, I entered SSO for a 30 cent gain. I have more faith in the TICK method for these ranging sort of days. We'll see how this whole idea works out in the wash.

I notice only now the pattern of the trade entries. Seeing as the range was set in just over the first hour the day can hardly be called a trending day but the pattern of generally higher lows after 1100h are similar to an uptrend. All of the entries in SSO (long SPX) are at the bottoms during the uptrend pattern. All of the trades in SDS (Short SPX) are somewhat later than the bottom during that same period. This leads me to check out the TICK chart closer for clues as to why...I suspect that an established uptrend has the MAs in synch whereas the counter trend takes longer for the MAs to indicate an entry against the grain...similar to a standard price chart.

Total gain for the thirteen trades was $1.78 per share of SDS and $0.64 per share of SSO.

Assume 100 share trades and deducting commissions that rings in at $112...USD so add about 20% for my currency...but that is all moot as I did not actually trade these trades with my currency.

The point is that, using the TICK entry setup I did not have a losing trade but every single trade at least broke even even after commissions. Checking over my stats from my short trial period leaves me with a 21:4 win/loss ratio. My worst day was 5 out of 9 trades loosing and still showing a net profit for the day.

Time to start the real trials to see if I can get anywhere close to those kind of win/loss numbers.

Jeff.


Change of direction...for me not the market necessarily

Today I decided not to do any real trading at all. All of my back testing has been productive and virtually profitable at first glance although I have not run everything to see exactly how profitable and how much of a factor fudging against me may have. Normally I run my theories and trials with real trading, yesterday I started to, but due to it being a holiday I only had time to get one trade in...I made a few dollars so that was OK.

So, instead of real trading I did some fake trading for the morning. I expected a range day which should be the worst type of day for me typically. A good test of my newish plan and I felt like keeping some of my cash in the event that I am off with my strategy...yes, that is new for me.

I have some new rules that incorporate a new revamped TICK chart with some cascading moving averages to act as guides. Their overall relative position play a role in deciding how tight to stop the trades. Their position relative to each other help to determine entry points along with the absolute TICK value. Of course the price charts of SSO and SDS and sector ETFs can help to lend some credence to the trade ideas.

I'll post some charts of some of my back testing and some of my fake trading from today later. I would like to compare the back testing stop exits against more realistic fake live testing.

It is worth noting that I did my back testing using only the TICK chart for entry determinations by advancing the chart a bar at a time. I placed arrows where I wanted in to set the time. The price would be determined by crosschecking the appropriate price chart after the fact and using the average of the high, low and close for the minute even though I should get close to best price based on the timing with the TICK. This allows my to treat these as mostly blind trades as I won't recognize the TICK chart pattern but I do tend to recall price chart patterns as they set up.

I just went back to the live charts and saw a nice TICK pattern setup, placed an arrow and checked the price chart a little while later. TICK is remaining above zero, averages slowly trending up. This setup was nicely confirmed by the high and close from yesterday acting as a support price. While I did not need to see the TICK for this trade the TICK did also set it up independent of the price support. I'll check later to see where it ended up based on my stop setting rules.

Jeff.

Friday, May 15, 2009

May 15th, Getting more acquainted with the TICK

I certainly wish this was as easy live as it is after the fact, but then everyone would be doing it and none of this would work.

Here is the TICK chart partitioned without regard to the actual SPY chart.

I should point out, the actual tick is not on this chart, I have the Bollinger Bands and a few moving averages. Almost those are enough to use... I am considering simplifying this chart for live use somehow. I think getting an overall feel for the movement may be more important than the absolute numbers represented here. I set up an alert that alerts me any time a TICK value hits + or - 800. Depending on the price setup these are great entry or exit points for trades.

Here is the SPY chart with the same partitions overlayed. Pretty close once again.

The ranging off the start uses the 200SMA as a support and tests it a few times before heading up to the upper range. The black horizontals are the high and low from yesterday so the whole day is really sort of a range day in that sense.

The TICK moving averages spent most of the day in the negative area once SPY came close to the upper range.

The key, obviously, is to be able to anticipate the change in the trend and place the trade accordingly. I missed playing the drop after 1100h due to just not paying attention. I placed a trade on SSO,was stopped out quickly and did not get the SDS trade in quick enough to catch the move... back to my market orders as they take no adjustment to setup before placing the order.

I entered a trade after 1330h anticipating an EOD rally off of the low from yesterday. I should have closed the trade in the green as it just wallowed around for almost an hour but I let my stop close me out...of course the higher volume activity at that point lost me a few more cents per share on my stop loss. Options expiration was somewhat a factor here so I should have been out of all trades earlier today than most other days.

Jeff.

Market order it is... again.

I think that I have given up on limit orders for more than the reasons mentioned in a previous post, that of missing the entry by a few pennies. Not only would that problem be solved but another more insidious problem may be rectified.

Upon setting the limit order where I want to get in the trade, and the price I set is a little low, I see that I tend to hold the order rather than cancelling it and often...often enough... that point is actually beyond the point where I should be getting into the trade. Determined to be right I leave the order in place only to have to close the position as it keeps moving the wrong way.

Market orders, on the other hand, have the advantage of being executed quickly, getting me in when I want and allowing me to make the decision based on the information at the time... not delayed into the future by an unknown amount of time. I do need to be aware that I should not use them when volatility is high though, but when there is enough depth on both the ask and bid side of the quotes to fill at the price that I want at that moment.

Now, back to the "a little low". Without the limit order in place I would not have placed a market order as the price was slightly too high for me, if it is out of my risk range...and this is the key. I set my limit within my risk range for the trade setup at the time, but the setup changes as time progresses.

With an active order in play I have a "want" to be right. With no active order I will be more apt to not place the order in the first place, re-evaluate the setup and decide once the price does move into range whether I still see a good trade idea...WITHOUT ANY PRIOR BIAS TOWARD MY OUTSTANDING ORDER.

No matter which order I use I will not chase a price but wait for a decent pullback into some level of support.

So, setting a limit and missing a price move for the sake of pennies or placing a market order that may cost a penny? I could post many charts and moves that limit orders have kept me out of and as many that they have gotten me in when I should not have been in.

I'll go for the higher cost as the price of missing the moves that I have missed outweighs that small cost. This is mostly a head game for me as I recognize my tendencies as I track my trades and ideas in my journal. I understand the benefit of a limit order but it does not suit my current trading style.

Caveat... I must use good judgement and not get caught in placing market orders just to get into a trade quickly.

Jeff.

Thursday, May 14, 2009

May 14th...nothing good to say.

Today was a perfect example of a good day to not trade...but not due to the market.

I was up late last night.
I did not sleep all that great.
The power went out early this morning... I have alarms to alert me to this for various reasons.
The dogs, due to being disturbed, wanted up and out.
The power never cam back on so I dealt with very limited water supply for morning routines.
I dragged myself into the office.

This does not provide a good mindset for anything so I should not be surprised that I was not on my game today...in fact I was not even in the same stadium.

Seven trades, all losers, most small, a few larger than my normal. I traded with an expectation, with a vengeance, with frustration...I finally threw in the towel.

Here is the NYSE TICK chart, for reference and for me to really see what really poor trading ideas I had. I dropped the bars and left the Bollinger Bands on with the various moving averages. SPY chart for reference to follow. The vertical bars are divisions between the apparent trending types over the day and this should give some direction to the trade styles to use during these times. I placed these lines in hindsight but without any other reference to charts.

Here is the corresponding SPY chart with the lines placed at the same times...only using the TICK references. The generalities of the TICK are pretty close to reality.

The light blue line is yesterday's opening price. The the low for today, during regular market hours, never broke the low for yesterday, the bottom of the chart is about $88.50, which was the low. Seeing as this was tested before 1000h it could be a good idea to stay long as long as the price stayed above that level with some conviction, found in the TICK trending up over the morning

Trades 1 and 4 could be timed to correspond with the rising low of the TICK and the testing of the 200SMA on the SPY.

Trade 2 was testing the 50 and 1/2 of R1 ( which I find useful often) and a TICK low, slightly higher risk but still a good pullback entry especially once the 30 crosses and the price tests both these SMAs shortly following the arrow.

Trade 3, a short, is the inverse of 2 as price tests the 30/50 on the underside. The heavy red line is yesterday's close, a decent resistance as it has been tested for about an hour. Target would be the 200SMA.

I have decided not to play the last hour as it is too volatile for my risk level right now...as long as I can follow that rule of mine.

While these are all hindsight trade setups they are setups that I will be watching for over the next while. The range market is the toughest to judge for me so I will try to stay away from it for a while.

Jeff.

Wednesday, May 13, 2009

May 13th

Nice trade setups today as TICK remained mostly below zero until late in the day.

I wasn't able to do any of the trades today but I did jot down some of the entries based on the live activity. I am reconsidering my decision to use limit orders to get into trades. The spread on the ETFs is almost always a penny. The trouble I am finding is that I decide where to place my limit based on terribly conservative loss allowances and I often miss the price for the sake of pennies. The only down fall in using market orders is sometimes I will not necessarily get the fill that I want. I don't mind paying an extra penny or two to get into the moves that I select, it is better than chasing a price after having taken the time to modify the limit order. Often this seems to be moments too late and the good moves missed outweigh the good entries.

Here is the TICK chart for the day:
SDS first as the day was a down day for the market, so an up day for the leveraged bear fund:

What I found interesting on this day was that the best entries occurred on, or very near, the 200 SMA line. I am using a 185 and 215 as alerts to notify me when the price gets close tot he 200SMA, it not ideal but is easier than trying to program a band on either side of the SMA.

Trade 1, SSO on the chart below, was not on the 200SMA entry criteria. The TICK made a low that matched the previous low shortly after 0930h but the price made aslightly higher low than the previous low...possible sign of an uptrend move, or at least a target trade to the 200SMA

Trades 2, 3, 5, 7 & 8 were easy as the price not only got very close to the 200SMA, which could still be a sole entry criteria, but the TICK also peaked near the upper range for the day at each point. TICK making equal highs and price making new higher lows at the same time on a classic resistance line, nice. I did try for a couple of these trades and missed due to limit orders with too low a price.

Trade 4 was the only one that I did enter, trying out the idea of the TICK with higher lows even without the 200SMA line as I try to get over not getting into moves even when they look over extended. I made a few dollars on that one, so it worked.

SSO:


Trade 6 was sort of flukie, 30/50 crossover. I was looking toward playing counter trend as the bottom looked to be there as there was a low, slightly lower low then a higher low, sort of an inverse head and shoulders pattern. With such a strong downtrend on the day up to that point I doubt that I would have made the trade unless I had already beat my daily goal and had some spare profits to kick around... although that is a good way to end up with a down day if not careful.

Jeff.

May 12th

Straight to the charts this time.

NYSE Cumulative TICK:

In hindsight I see the obvious overall pattern as the TICK trends down, up, down then back up again. Here is the SSO chart for the same period and the correspondence is unmistakable

I misjudged a turn around on that first trade. The second was bang on except I moved my stop up on that first little rally after my entry, had I left it longer I would have captured some decent amount of the following move as the price rallied from that $25.21 entry up to the pivot point at $25.84 and a bit beyond.

Here is where most of the early day activity was prime, SDS.

These trades were well placed, although I missed the volume signal off the start. The TICK at this point was slightly positive (reverse correlation here) but the price would not move down, then the volume levels spiked and stayed that way for a few minutes while things wound up. There was a really nice entry for a few minutes but I missed it altogether. Once it started to move I jumped in as the high from yesterday was breached (black line) and bailed at R1 for a small profit.

#2 stopped out too short


#3 was pretty good and I bailed at R1 again figuring this was a good resistance point.


#4 didn't make it to R1 and I held it back to a small loss


#6 very sadly stopped out but it was at break even, case of moving the stop too soon

#7 was a good entry for a 200sma bounce but it did no bounce, so I reversed in the second trade in SSO...which stopped out.

I didn't get back until after lunch to even look at the market activity or I expect I would have jumped back in at the pulbacks in SDS over the next hour as everything lined up for nice clean uptrending entries.

These trade ideas are starting to work out well enough on the idea basis alone...now I just have to work on the executions.

I am finishing this up as Wednesday is progressing. Although this is a nice expected dowtrending day, and it has been following expectations, I have not been able to do much about it due to appointments. I'll throw up a chart later.

Jeff.

Tuesday, May 12, 2009

The TICKer testing continues

Sunday I spent a bit of time (not enough) testing my TICKer entry and exit strategy doing a bar by bar trading day on the minute charts for SSO, SDS and the NYSE Cumulative TICK charts. I just went back and picked a day with no reference to the daily chart so I did not get an idea if it was a trending day or not. I want to get a couple of trending, range and mixed days in over this week.

Doing it this way I do not get any sense of how the individual bars are behaving minute by minute, no 5 second updates on the TICK, no play as a volume bar alternates between green and red as the price hovers or reverses...less noise basically. I give myself about 10-20 seconds, or less, to decide on a trade as each bar passes and use the entry of the close of the last bar (most bars will test this number before moving on...not all so not all orders are necessarily filled).

I am finding that using the straight 200SMA as an entry platform is too restricting, especially on ranging days as often this line becomes the median, or it seems that way. Trades invariably end up with 1/2 sized moves as a result and often the trade goes negative quickly as well. Getting in at the end of a swing or at the bottom of a pullback seems to be a better target in general. With tight stop loss orders and trend appropriate targets these should be able to be nice trades.

Like anything else, it boils down to familiarity.

I know I have been all over trading without emotion but that cannot be eliminated completely so I decided to just observe moderation. Should a trade go against me I concentrate on the setup and determine what I might have seen that would indicate this turn. Often there is nothing to see, the fickle market just decided to take some of my cash, other times I entered with no real firm edge and failed to exit once I realized that the trade was likely to go south. Even after being in a profit position, albeit small, and thinking to myself, "I should cut now" I hold figuring that the price has already been near my loss point, I'll let it go and see....


Yesterday was a fairly tight range bound day as the S&P 500 reached up for 919 and down toward 908. That makes SPY range from a high of $92.11 to a low of $91.04... barely a dollar to play with. I made 4 trades, five actually but I don't count the fifth as I did not follow my rules but went on a whim trade based on a post by someone else...I should know better. More on this chatter another time.

Anyway, of the four trades, two lost a bit and two gained a bit. I don't have the numbers in front of me but I was down overall due to the fifth trade and perhaps the commissions.

Seeing as the market seems to be poised to go SOMEWHERE soon I hope to recognize the type of trading day early and get the opportunity to make the best of it.

Jeff.


The TICK chart was good at indicating high probability entries, I am still working on real time recognition but it is coming.

Saturday, May 9, 2009

TICK trading the S&P 500 using SSO

Here is an interesting TICK triggered trading plan worked out for yesterday. This is, more or less, what I was trying to accomplish on Friday. I did catch a good chunk of the two largest moves of the day but working strictly off of the 200SMA is somewhat profit restricting. I have liked the idea of fading to the 200SMA and have tried that a few times with limited success (read: more loss than profit).

So here is an example of back testing a day using some of my newer ideas. I know the day is recent so the results may be to optimistic but the theory is sound and the charting is a great exercise. I will do the same thing for the SSO side of the day, although I would tend to try to not trade against a trend setting day...once I realized that is what it was.

For the TICK chart (second chart):
Plot the 25 or 30 SMA, red
Plot the 200 SMA, green
Bollinger Bands at 20 period, 2 standard deviations (I just like these, I don't think I would use them for triggers though. I like the narrow and wide indication of volatility.

Here is the SSO chart for yesterday:


I know the TICK chart is tight, I use it much narrower and with wider spacing but this is easier than trying to split the day into two charts.
May 8th observations:

TICK strong off the start, 25 over 200 and both UTing.


Trades as charted:

0938h - Entry on first up bar after a bottom... coincided with a 200 entry.
NOTE: Expanding volume confirmation after entry
0950h - Exit on second full bar below the entry bar in TICK, R1 failed test as the primary
1051h - Entry after first positive TICK bar following 25 over 200 cross pullback to -800 range
NOTE: This happens to have been the second test of the primary pivot point
1120h - Exit after failed test of the 200SMA, no TICK reason, could have held
NOTE: the next entry the tick level was lower yet produced an even price from the previous exit... sign of an UT in progress.
1150h - Enter test of 200SMA, TICK testing low trend line
NOTE: 25tick SMA steeper slope than 200SMA, UTing, more positive TICKs
1221h - Exit second failed test of R1 (R1 is a good resistance level)
1251h - Enter following low TICK, bear -800, VWMA test, increasing TICK
NOTE: TICK not trending, horizontal ... tight stops or target trades, aim for R1 again
1258h - Exit, R1 again, don't wait for the fail due to third time testing and neutral 25SMA TICK
NOTE: no new highs or lows for the next period, wait for the 200sma test.
1400h - 200SMA test and TICK low reading
NOTE: TICK returns to small UT here, breaks R1 on good volume, stop at VWMA
NOTE: TICK lows do not produce new price lows, stop to R1
1455h - Exit as yesterday's high test failed for 4 or 6 bars, TICK turns DT afterwards so exit imminent anyway

The rest of the day TICK highs and lows do not produce new price highs or lows. I don't care much for trying to play the EOD volatility anyway.


Jeff.

Thursday, May 7, 2009

May 7th, VWMA (or VWAP)

I have been seeing this talked about with no real details as to what the formula is or the period used. I use Esignal and they have a Volume Weighted Moving Average but I found that it was close enough to the regular simple moving averages that the resulting line was superfluous. I have found that a 100 minute VWMA works well (equivalent to a 20 minute on a five minute chart). Even so, I am not sure that a VWMA has much more significance over a regular SMA.

The largest difference between the two averages shows up in the afterhours trading when the volume is very thin relative to the intraday trading. I think I need to look at this closer as to whether it is really of any value to me or not, compared with the SMA.

Having said that I will use the VWMA anyway. It is the purple thick line on any of the following charts.

The rest of the lines are as follows:
Red - 30SMA Blue - 50SMA Green (thick) - 200SMA Purple (thick) - 100VWMA
The horizontal lines are various support and resistance lines based on pivot points, OHLC of the prior day etc.

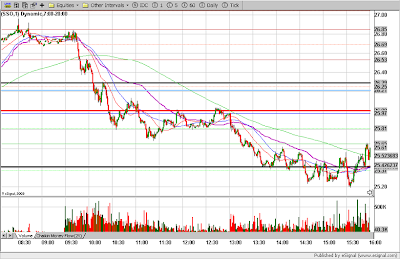
First off is the chart for SSO for the day. There is a bit of pre-market in there, that's just how it works out. Obviously there was not too much to trade here as everything pretty much was heading down most of the day.

Comparing the TICK chart for the day produces an interesting correlation, easier to see after the fact though. I plotted the heavy black lines as general median lines to represent the general trend of the TICK.

Notice how the TICK heads down and the price heads down steeply, then, as the TICK turns back up the price only holds it's own...that is a good sign that there is weakness in the market in general. There are other quicker indicators than this but this one can be used to determine trade entries. As the TICK reaches a high spike, in the +800 range and the price of SSO, SPY or any other S&P500 index related fund does not produce a higher high then it may be a decent time to consider an entry short, or SDS.

Should the TICK peak produce a higher high then the price may start heading back up, consider long at the next low TICK reading. Generally the TICK chart for today remained mostly below zero but did not produce many -800 readings until later...even then the -800's did not drag the price as low as might be expected in a weak market. I guess that would indicate that wholesale selloffs are not in th eworks right now, just some consolidation.

Now, on the other hand, SDS produced some really nice buying opportunites. I managed to get in on one of the earlier ones but the tone of the day at work did not let me do much other than pay cursory attention to the activity so I did not remain in any position. ECN connection troubles kept me out for most of the morning and the afternoon needed more attention to trade than I could afford.

It's hard to tell from the TICK chart but there were nice peaks that corresponded with the arrow marked possible entries based on the TICK/market correlation. I did jot down a few trades to keep my mind in the game at least and they were profitable.

One of these days...or weeks I guess, I will get to trade uninterrupted and take advantage of some of the things that I am learning.

Jeff.


Wednesday, May 6, 2009

Following the TICK to market moves

Yesterday I set out to work on my trade entries in order to use the limit orders more effectively and get trades entered more timely. While I did OK based solely on that premise I found that I entered more trades than I should have due to not really knowing where to expect the next move to go, getting stopped out and just trying again if the setup looked half decent. I was concentrating on chart setups, but, due to the choppy activity, that did not work well.

Today my goal was to stay on top of the trend of the market in order to stay out of those questionable trades and to get a better handle on how the prices were moving in response to the general market, the TICK and various support and resistance lines. My secondary goal was to also watch the entries as I did yesterday to get in at good points and prices.

I made four trades and I stayed out of some nasty trades. On the other hand I missed a few trades while sizing up the activity. I missed a few again due to interruptions, today was not a great trading day for that reason alone. At least I did not miss out on a great trending day.

I did make a fifth trade in the last 30 minutes...yes, broke my late trade only on profit rule...I should know better. When I wanted out at about 5 cents down it went 18 cents down before my market order was filled. FILO strikes again.

No charts today. Ran out of time to play. Not much to show anyway.

Jeff.

Tuesday, May 5, 2009

May 5th, non-profit goal

Not much to say about the intraday market activity in the S&P 500 today, bears and bulls were uncommitted which makes for a range day. So, in the spirit of the day I took on more trades than I normally do, 10 altogether. I would consider that over trading as some of the entries may not have been justified or properly thought out.

Having said that I was working on a novel approach to the start of the day by setting out a goal, a non-monetary one by asking the question, "What do I want to work on today?", Inspired by Brett Steenbarger's post earlier today.

I decided to work on waiting for my target zone entry and getting my limit orders placed more timely.

Notice there was no hint of "making more money", "catching bigger moves" etc. I figure that if I can get into trades at better timelines then I can use tighter stop loss orders, have lower entry prices and be there when the moves do move. That will, eventually, turn into profits.

Here is the day chart for SSO, the Proshares leveraged ETF which exhibits the same rough pattern as the SPX, S&P 500 index. This is, more or less, SPY on steroids. The pivot point (blue line) and the yesterday's high (black line) are close tot he same area though.

From my pre-market journal entry:

"SSO to bump the 200sma then DT - at least range to the Pivot Point."

Well, it bumped and passed the 200, but I had a plan initially and it was close. So I am satisfied with that much to start.

Here are the trades in SSO, I should have followed my instincts and not placed any SSO orders so early, but the 200 crossings looked OK to test out my entries, they were tight, again, satisfied, just not the best ideas.

The TICK, as charted below for the same timeperiod as SSO above, has no real defined move past the + /- 800 (green and red). The trend, which is pretty obvious but I stuck the black line to represent the rough median, shows the inclination of the market to hover around neutral with a bit of a downward bias.


Here is the chart for SDS, Proshares leveraged bear ETF, for the morning showing my trades. This shows that my plan did, in fact, produce the results that I was looking for with my opening goal of what I wanted to work on today. Had I followed my original idea of only trading the downmoves toward the pivot (in SSO) which are the upmoves in SDS toward it's inverse pivot, then I would have made out better as I would have seen a 36 cps return instead of the piddly 13 cps that I did see.

In addition to having my entries down tighter and timelier I need to work on either following my pre-market instinct or at least recognizing the general trend as it develops better...or, more appropriately, not try so hard for the counter trend moves. I did like that little momentum move at the end of my SSO trading though. Once I realized that I could fade SSO off of the pivot back to the 200sma using the TICK as an entry trigger...that could have been made use of earlier in the day to my advantage...one thing at a time though.
BTW, I am glad that I did not try to trade into the afternoon as it was choppier than the morning and I might have gotten discouraged by the whipsaws. Looking solely at teh chart, without the TICK and anything else, I would have a hard time placing hindsight orders...although that muliple test of the pivot near the end looks like it needs some further investigation for possible setups in future...
Jeff.


Monday, May 4, 2009

Lunch interlude and beyond

I usually go home for lunch, and, due to a variety of variables, I end up going later than the classic noon lunch...but that is beside the point.

I opened up my trading platform and related softwares to see what was stirring. I tried a trade right around 1230h, once again, against my trading plan. I entered SDS on an downtrending 200sma...I was paying more attention to some twitters when I should have been paying closer attention to the market. Even so, an downward moving 200sma is pretty blatant and hard to miss.

I like to enter trades based on an upward sloping 200sma preferably with the 30 and 50 also above. These setups seem to work out the best partly due to they indicate a short term trend and partly as the price likes to crawl along the 200 often before making it's move, sort of a consolidation line. If it is downtrending the price often heads down for a bit first.

The one that I missed (yep, a day of missing here) was one that I aimed for, did not follow my rules completely...even though I was right I flubbed the entry as a result. Upward sloping 200sma, 30 and 50 above but I did not wait for the pullback to the 200...which happened afterwards while I was heading back to the office....to the penny. It also followed through precisely as I might expect it to. It did not move all that much but the entry was the idea, sort of a scalping trade at this point in the day, hard tight stops or just exiting upon apparent weakness.

I wasn't going to chart it, but here is the afternoon bit.


Jeff.

For the sake of a penny the dollar was lost.

Well, nothing was lost and, yes, for the sake of a few pennies a nice entry was missed.

Today was one of those days that I was hoping for, a trend setting right off the bell. As of right now it still looks that way but one ever really knows for sure.

So, after all of my hyperbole about "being there for the trend days" and seeing some really nice gains as a result, I missed the boat this morning... or did I?

The pre-market looked great, FTSE closed so no factor there at all, TICK all positive and strong for early trading, most sectors were up, swine flu down China stronger.

My journal entry included, "expect a small gap up or a strong start at $24.14, watch the range to $24.54". I set my limit order for $24.17 in expectation that the price would test the 200 around the $24.14 area...I watched as it hovered around $24.20-30 range. In this particular case I "should " have increased my loss allowance a bit to enter the trade at the 20 cent mark...but I did not. Where does one draw the line?

I also could have entered as the $24.54 level was breached as it did waver at that level before taking off again. Technically that would not have been price chasing as it was a level I established as support/resistance. But it was not in my initial entry plan.

Anyway, using my 50sma stop settings I see a 70 cent gain and the trade would have closed about 1045h. I would like to think that I would have given the price more room and stuck with the S/R line just under until the price either re-crossed above the 50sma or tested it from the downside and failed. I should look at using 30/50 crossovers for stop settings as well.

Analyzing the trade closer, as if I knew that I was going to be correct in my forecast and nailed the first entry, here is the chart:


Doing the math on the entries assuming that I start with 200 shares. The $24.54 entry takes me to ACB of $24.37 and my stop climbs to $24.42 for the whole position as soon as I enter. That leaves me with at least a few cents per share profit. Following up the the next support resistance level and deciding that the market is still strong another 100 shares gets added and the stop is as depicted. ACB is now $24.46 and the stop is climbing from $24.60 to $24.70 and caps out at the next S/R at $24.82. Paper gain at this point, if stopped at the end of the chart would be about 49 cps or $245.

So did I miss the boat? Am I disappointed that I did not chase the price or make some of the other nice entries?

I don't really think so as I am not really profit focused but I am learning focused. I got to watch a really nice morning uptrend and play the points along the way to see what I could have done. Yes, I miss not having a position in play. I don't expect that I would have entered the last 100 shares, but I expect that I likely would have entered the second trade addition...or at the very least still been in my core position. I was determined to trade according to plan and right now I am focusing on plays that include the 200sma entry. I need to start somewhere.

The market still looks good but not strong. I am going to watch closely as the price and 200sma approach one another later today as I think there may be an afternoon reversal in the works.

I think that I would be taking some of the position off along the way, perhaps a stepped row of stop orders in 100, 200 and 200 size closures to ensure profit and leave more room for more rallying.

Jeff.

Sunday, May 3, 2009

Information overload, tools and intent.

Too much information to try to assimilate and internalize in one go, even though it's been a longish go.

I am needing to concentrate on fewer things in order to focus and get into a groove in my trading. This switching over to the NYSE and AMEX have opened a whole new world of information that, while I knew it was there, still proves a daunting task to sift through it to select the parts that I need or want to use.

I need to pick one or two complimentary bits and work with them, prove their use then add on more as I feel more comfortable with the first.

I still like the PP200 entries, and they worked out well today, so that will be the basis for my trading. I like the TICK chart so I will add that to get used to the price moves and the TICK correlation as I have used it to help with some timing and trend indication.

So, 200SMA, pivot points (monthly and daily), previous day OHLC

I will continue to keep an eye to the ADD but I find it just follows along with the price of SPY, or the value of the SPX. Also I see that trading SPY or SSO are similar enough to not need the leveraged ETF. SH vs SDS on the other hand have such a variance in volume that I might be concerned with trying to get out of an SH trade in a hurry in a fast moving market.

Other things that have crept into my view are, in no particular order:

VIX (a very interesting beastie, but of questionable use)
VWAP and WVMA (Volume Weighted, jury is out on this one, just another MA?)
Converging MAs (this one looks cool but ties up CPU resources terribly)
Sector ETFs (good for a general overall view of a market, helpful in trend determination)
ADD (see above)
Volume by Price (not readily available in a useful format through Esignals, interesting and needs more attention though)
SPY spikes (I think these are indicative of the nature of the ETFs and may have some level of predictive value, more back testing)

Odd notes about Volume.

I am still not so sure how much good volume is when trading an ETF as the price is based upon the underlying index valuation...volume can skew the price by the spread, can increase or decrease the spread but cannot move the actual price. So the volume is more a market participant gauge rather than a sure fire method to judge a move. Although on a large volume ETF I guess it can be a good herd indicator. Spy is so popular that many trade it as if it were a stock...but it's not.

Today I did some quick back testing on a pure volume trade entry with manual stops in the vein of a semi-mechanical trading style. The back testing looked good, and I might post something on it another time, but, true to form, I put it to the test to see how it executes. Well, mix a new style with end of day market and I am sure to get burned.

More to the point of the ETF volume though, I think that a pure volume trigger could work but I would expect it would work better on a high volume stock... Mmmmm...I feel some more back testing coming up this weekend.

This leads me to thinking that perhaps the fun of trading is not so much the trading itself but the trial and proving of a system. I have a hard time sticking to one thing long enough and with enough tenacity to let it show it's merit before adding something else into the mix. Constant interruptions and the odd connection glitch don't help matters either, but those are just excuses for the fact that I am not trying hard enough to actually make any money at this little venture.

Jeff.

Morgan Stanley, the alternate trades and April 21st chart.

I am trying to focus on one sector or index at a time in order to get familiar with the activity well enough that I don't have to think much about the indicators, just glance at them and know what may be coming next. As much as I may not be profitable right now I am gaining knowledge and that familiarity that cannot be gained in a strong easy to trade market.

Having said that I have kept my eyes out for those other gems that may be out there and are within my trading range. Morgan Stanley, MS, is just one such gem. Lots of volume, lots of activity and a price that allows me to choose a variety of position sizing.

The only real reason for not getting into this stock is that I cannot short sell in a registered account so my playing is limited to the upside trades so I am just on the sidelines for now. Later I may get my margin account going for some shorts.

This basically means that I am stuck with ETFs of the bear variety to play any downside.

On that line, I see some argument for sector rotation for trading. I see that this is similar to choosing a stock that may be a good trade on a particular day as, no doubt, the sector that a stock is in will be reflected in the stock movement, or the other way around.

I am trying not to get caught in the indecision that comes with choosing a different issue for a day as I tried that in the past and I invariably chose wrong and ended up fighting the tape for pennies when i could have grabbed a nice trend in one of my other choices... in hindsight of course.

So this is why I stick it out with one set of ETFs in one index right now. I figure that I will fight on those range days when almost no moves are terribly predictable but I will be there on those days that the ETF trends with the index. April 21st was one such day...and I recall not being able to trade until late in the day...after 1500h so I missed it but not due to trading something else, I just was not there. This was so shortly after switching to the NYSE that I don't know if I would have recognized the trend or if I would have just traded my plan and been caught up in the trend by default. I would like to think I would have been positioned right but I also think that I would have stopped out quickly.

I see that I did not post a chart for the day, I only had one trade late in the day and I am not sure now exactly why, my journal entry is not clear. I think I just felt the need to try a late day trade to see if I could catch the right side of the late day volatility... I was not successful.

Here is the chart with some arrows indicating possible trades and direction. I would be playing SDS for the short trades. I think that the TICK for the day was mostly positive off the start so today I would not likely have entered any SDS (short) trades at all. There are a couple of points where I may have entered additional lots along the way, perhaps not then so the point is moot. I might now once there is a enough money on the table to turn a profit even after the cost averaging.

SSO for April 21st:

The long green arrow represents my use of the 50 sma as a stop guide. I worked out a variety of methods of trend stop setting (125 sma, pivot point & support lines, 200sma stops) The 50 sma worked out the best price but even the worst was within 12 cents of the best. There were at least two more decent smaller trades after this main one, which I did not mark. These were the 200sma retest at 1500h and at 1545h.

For interest sake I entered long at 1535h, I must have been trying to get the bounce off of the 50sma, oh well.

Jeff.

Friday, May 1, 2009

Looking for a nice trending day.

I have now reigned myself in so that I trade according to my plans, the trouble is that my plans favour a trending day better then a range or mixed day as I tend to try to leave the price room to go when I should be exiting on momentum. I need to work on recognizing when the trend shifts so I can better use momentum targets and wider stops when appropriate.

As a result I had a mixed day today. I expected the downmove in the SPX off the start but didn't get my order in for SDS quick enough at my price to catch the move...next move I tightened up too soon expecting a similar quick rally. The day kind of went like that. Seeing as I was using the 200sma to use as my trade launching and there were three solid crosses and as many periods when it was being tested I had lots of opportunity to try some trading... just not a lot of large quick moves from it.

This is a day when it would be better to fade the moves toward this line, but where to select the entry... I think that these would be less likely to be good clean entries than what I am playing with now so I will continue this method.

I am getting to recognize the TICK divergences on the fly, good day to watch those setup with the price moving about as it did. Something about a three wave pattern seems to be normal for a ranging or mixed day...might even be able to time trades off of the extreme TICK moves...sort of like a reversion to the mean but not specifically with the price action. More on that another time as I think it warrants some investigation along the lines of trading the reversion to the 200 or maybe the pivot point.
Here is the 5 minute period chart for SPY today, note the nice smooth wavey 200sma green line. I recalculated the SMAs to be valid as if this were a minute chart...so the 200 on the 5 minute bar chart is still a 200 minute moving average. I don't have the patience to trade five minute bars but they are nice for quick reference.

I had eight trades and none of them were great gainers or losers, suffice it to say I got a little chopped up even though I had good entries. Some stops were too tight and I didn't feel comfortable getting back, a couple of trades were just wrong, the idea was sound, I misjudged the strength of the market at the time...or perhaps the weakness.

I have not done the overall profit loss for the week but I know I am down, just not how much. Regardless, I am really enjoying the revelations that I am having and am looking forward to the time when I can trade and be confident of a good day regardless of the market activity.

BTW, I am heartened by some of the timelines for active traders to start being good as heard from professional traders when they are referring to their new traders in there firms. Seeing as I have had zero formal education about trading and markets I can consider myself doing as well as can be expected...actually better as most have lost it by now, apparently.

Jeff.