Questrade, My direct access discount broker.

Questrade Democratic Pricing - 1 cent per share, $4.95 min / $9.95 max

Thursday, January 29, 2009

ETFs for gold...HGU and HGD. Day 1

ETFs are what they are, an Exchange Traded Fund so their basic price follows the related fund closely with some variance in the actual purchase and sale price due to the auction style of trading, just like a stock in that regard...there is a spread between the bids and asks. Enough about that.

HGU - Horizons Betapro Global Gold Bull Plus Fund
HGD - Horizons Betapro Global Gold Bearl Plus Fund
SPTGD - TSX Global Gold Index
AEM - Agnico-Eagle Mines, a stock for some reference as I am familiar with it and it tends to lead the index slightly.

I will only chart HGU for today's trading (fake)

The short story:

0934h Buy $11.23 Sell $12.00 Gain 77 cents ps Return 6.9%
1009h Buy $12.07 Sell $12.30 Gain 23 cents ps Return 1.9%
1030h Buy $12.31 Sell $12.50 Gain 19 cents ps Return 1.5%
1105h Buy $12.31 Sell $12.51 Gain 20 cents ps Return 1.6%
1154h Buy $12.32 Sell $12.44 Gain 12 cents ps Return 1.0%
1258h Buy $12.62 Sell $12.89 Gain 27 cents ps Return 2.1%

$ 1.78 gain per share or 15% overall return on trades

That translates into $474 virtual dollars profit or 11.9% return on portfolio.

The slightly longer story:

The main reason that I did not actually trade these today was due to the fact that I slept in, health issue and missed alarm, I think I did not wset it properly. I ended up with 10 minutes to do my chart setups for a whole new bunch of stocks and funds. So I saw the first trade setup and just did not have all my ducks in a row.

I followed some pretty hard and fast rules for these trades though once I got them going. Being a newish trading setup I decided, after missing that first large move, that I was asking for trouble trying to make some real money today.

Entries were based on limit orders set 2 cents higher than the pivot point being tested. I could also use market orders to be sure of a full fill each time but I will keep to limit orders to reduce the possible jumpy trade price filling me higher than I would like.

Exits were based on the next pivot target, following if momentum was good and exiting before targets if the buying weakened.

I did track a few trades for HGD, the bear version, but didn't count them as they were less than stellar, profitable but small and really were against the trend altogether, just for practise.

Jeff.

Wednesday, January 28, 2009

January 28th...flat

Today was a small target day, again but worse than yesterday. I decided that my pivot points were so close together that trade targets were so small as to not be real targets, support or resistance at all. So, in keeping with my normal plan I fake traded anyway to see how this might lay out for future reference. I'll post the TLM chart just for curiosity's sake.


The entire range was contained within the $11.97 to $12.29 area, that's a total delta of 32 cents. Not much room here to play with. The price was not supported or resisted by the various pivot points very well today as any move was likely to overshoot them easily. I almost did not even other looking at anything today but figured that faking a trade day in such tight quarteres might be a good thing. I did track a few trades to see where I might have ended up.

1013h Buy $12.12 Sell $12.21 Gain 9 cents ps Return 0.7%
1231h Buy $12.12 Sell $12.27 Gain 15 cents ps Return 1.2%
1113h Buy $12.12 Sell $12.14 Gain 2 cents ps Return 0.2%
1220h Buy $12.12 Sell $12.15 Gain 3 cents ps Return 0.2%
1251h Buy $12.12 Sell $12.15 Gain 3 cents ps Return 0.2%
1321h Buy $12.12 Sell $12.18 Gain 5 cents ps Return 0.4%

$ 0.37 gain per share or 2.9% overall return on trades

That would not be too bad except that there are commissions to take in to account...even Questrade's low commissions turns an $111 day into a $51 day...still that is 1.3% on the initial portfolio, so that would still meet the goal for the day...but it is a lot of work as I would have been better to stop after the first two trades as the rest is pretty much just breaking even. I did not even bother checking into HED today at all.

Jeff.

ETF's, gold...HGU and HGD

I receive a few free reports from things that I signed up for over the last year or so. Usually it is just the same dribble about markets and commodities and cliches trying to sell me services. There is one that seems to be on the mark more often than most and it is put out by the classic "professional trader who has made tons of money guru"...whatever. It takes a moment to glance at it so I keep it coming. Every once in a while I glean a thing or two from the chaff.


Today I went looking for stocks in th $10 - $20 range to freshen up my DTing portfolio, my energy stuff is getting too tight (total pivot point range is $1 so the targets are so small as to be non-existant...these points won't be much good. More on that later)

Anyway. I reworked a separate portfolio in gold, which is where I started this whole DTing thing. Looked at the HGU and HGD to play against each other as they are both in the $10 range right now it is a great time to start with them. I need to do a little historical study first.

My point is that today the "guru" sent an email about trading gold, specifically gold ETFs. How ironic. "timing is right" and all that stuff.

Any market condition is easy enough to spot if what you are trading slows down to a point where it may be prudent to start looking elsewhere. A good direction is usually to see what gold is doing then spread out to the other sectors, financials, transport, resources, etc. Just find a stock that is moving with the idex, roughly, then either play it long and short or pick the corresponding bear ETF to play the downside.

This particular case is a slow tight market all around. Why is not important. Just keep flexible.

Jeff.

Tuesday, January 27, 2009

January 27th

Bummer day today, just didn't make the trades but the day was a small target day all around. I tracked a few trades but didn't pull the trigger on any of them, didn'y feel like getting most of my profits eaten up by commissions for little return.

Having said that my few trades didn't do too bad. Every time I go through this process this month I have decided to not make the trade but jot down the planned entry and exits as if I were in.


0932h Buy $11.96 Sell $12.00 Gain 4 cents ps Return 0.3%
0935h Buy $11.93 Sell $12.04 Gain 11 cents ps Return 0.9%
1008h Buy $11.76 Sell $11.95 Gain 19 cents ps Return 1.6%
1111h Buy $11.95 Sell $11.99 Gain 4 cents ps Return 0.3%

$0.38 gain per share or 3.1% overall return on trades

Pretty small stuff but still all winning trades...and still $74 after commissions...1.85% return on the portfolio which is still over my 1% daily target

The last trade, although small, was a nice technical setup as I managed to write down the two possibilities:

"setup at 1/2S1 but the 200 4 cents higher - resistance - wait for

1) drop to S1 for entry

2) cross 200sma for entry"

It crossed the 200, I got in, watched for the waver and got out. A good trade in that it did what I expected off the bat, just did not follow through for a larger gain. The whole point here is that the exit is as important as the entry and both were executed according to plan. I could have held it through the pullback to $11.95 and subsequent rally but I MAY have gained another penny or two...and if I had held for the first pullback my mind is set on holding through so I would have ended up losing as the price plummeted to below my entry.

These days are only good for smaller targets so take the smaller profits when they arise and this will keep the losers at bay.

Ther is a cliche in trading that states, "cut the losers short and let the winners run". That is all fine and dandy but a cliche does not a plan make. Small churning markets are no place to try to let a trade run when there is profit on the table, too risky.

Jeff.


January 26th, looking back a day.

Talisman Energy chart.


PP200 firm rule following today.

I checked the pre-market and figured that a run for R1 was in order, it made it sooner than I anticipated as the price opened above 1/2R1, hit R1 and hovered for 15 minutes then climbed again. I got taken by surprise as there was no pullback to test R1 so I did not get my entry. I think the long waver just under R1 might indicate that my PPs are a little high today. That and the quotes looked too heavy in the asks to comfortably enter a long position hoping for a quick R1 break. So the price made it to 1/2R2.

There were some small target possibilities over lunch as the 200 rose and crossed the price. At shortly after noon it looked like the 200 was setting up as nice support with 1/2R2 as the target. As it fails on the fourth test it becomes resistance. This is were I would just tkae a break as the targets between the 200 and the two closest pivot points are just too small.

I did make a trade at 1253h off of R1 as I figured that was as high as the 200 was likely to get, so I tested my entry plan.
R1=$12.11
Limit order filled at $12.12 (target is to be within 2 cents of the PP price)
Price reached $12.21 and I closed at $12.20
8 cents per share. Certainly nothing to write home about but still a $24 trade with 300 shares.

I almost made a second similar trade at 1257h but with the dropping 30 and 50 sma lines together I figured my target was no longer the 200sma. That and with the price under the tendancy might be towards a continuation of the down trend so I would be trading against the trend big time.

Speaking of trends and moving averages. It could be argued that there were a total of three trades this day.
Long form 0930h to 1130h
Short from 1130h to 1430h
Long from 1430 to 1530h.
For a rough total of about 90 cents per share

At 1330h there is a really nice example of why I like short selling so much. R1 gets broken on the way down, hesitates just enough for an entry and topples 25 cents in about 15 minutes. For curiosity sake that is about $5 per minute at my 300 shares.

This is the point where I should be entering HED long as capped energy peaked twice very near it's 1/2R2...Trying to follow PP200 I was watching for HED to hit 1/2S2. The relationship between it's pivot points and price are probably not as firm as it realy follows the index rather than it's own trading, so they are guidelines only. I know this but am hesitant to trade it until I get a firm foothold with TLM and the long only trades.

Horizons Betapro chart


I have been concentrating on a single stock trade for some time now and I have a hard time tracking two, especially one that inversely correlates. This may take some getting used to.

Jeff.

Backtesting

I was a fan of backtesting when I started looking at trading as it gave me some cool numbers to indicate what I "could" have profited had I followed a particular strategy. I learned a few things about the fallacy of backtesting in the process, namely that it is historical and can be misleading.

The key is that the testing proves that a strategy has potential and needs to be followed up with live testing.

I did a bit of historical testing of what I am calling PP200, just 8 trading days worth.

I used the PP, R and S lines primarily, the 200sma for some reference and the 1/2 lines occasionally. I placed the orders on the first pullback to test the respective lines and exited on a re-crossing, weakening of the price, next line hit or, if the move had a large momentum then when the price move weakened after the next target was crossed. Orders were only placed if the pullback came to within 2 cents of the target line to give me a mechanical entry criteria. Price used was the target plus 2 cents for the entry and minus 2 cents on the exit. Trading was stopped every day at 1300h. Commissions are accounted for in the net profits.


There were very few losing trades, which surprised me as I expected a fair number, perhaps as high as 40%. I only saw 6%, so I will assume that is higher in real life. There were fifty trades altogether.

TLM, long only trades

Average daily return (based on the full $4K portfolio) was 1.45%
Total for the period was 11.6%

HED, long only trades

Average daily return (based on the full $4K portfolio) was 2.68%
Total for the period was 21.45%

$1322 total combined net return or 33%.

My normal fudge is to drop the net return by another 30%, so that makes $925.40 or 23.1%

Interestingly the HED trades only number 16 but almost doubled the returns from 34 trades of TLM. I think this may be due to the fact that HED follows the capped energy index and smooths out the variances and hiccups along the way whereas TLM is a straight up stock. I believe that this will require some testing under fire as this mitigation may prove useful for smoother trading results.

Either way that is a decent return for two weeks trading. One of these days I will get around to applying this strategy to prove the results.

I keep in mind that all of the live testing that I have done in the past was with real money and I had no qualms about losing a bit here and there in the interest of learning the ropes. This month I have been very hesitant to pull the trigger even though I know my strategy. It would appear that "getting serious" has some psychological implications that I did not anticipate.

Jeff.

Friday, January 23, 2009

Questrade, a little plugging I suppose...

I popped some Questrade advertising on my blog as I am sure anyone reading now has noticed. I figure that I use them and am satisfied with their service that perhaps others that are just starting out might want to give them a try...and take advantage of the $50 in free trades to boot. Perhaps some might be looking for a more cost effective method to trade when they do not require the hand holding that is supposed to go along with their current full service broker.

I was at a meeting of my local share club (DRIP club) and the topic of brokers came up. The discussion was in reference to the TFSA mainly as there are administration fees and withdrawal fees for these as well at other brokers, primarily bank brokerages, but the discussion headed to fees and practises in general. I was surprised at some of the fees and policies that there are in place at some "full service" brokers. I even hear of certain types of orders costing more in commissions than others...limit orders specifically, maybe VTSOs as well. Perhaps these are phone orders as opposed to online or direct access orders but it certainly puts a splash of cold water on a trading plan to have capital eaten up this way.

I know when I started looking for a broker I did not look too far. I checked my bank and was shocked at the fees so I checked a few online brokers and did a straight cost comparison based on my needs and expectations. Considering that I really did not have any idea where my trading might end up I do feel that they have been a good fit for all of the trading that I have been doing so far...and I have tried a lot of different styles, methods and trade types.

I have not gotten into options yet. Maybe sometime but I do have them available in the accounts should I decide to.

I have mentioned most of this somewhere in my blog already but I thought it worth mentioning again as more and more people are looking to get into some level of trading or investing.

It is not normally my style to come across as trying to pitch a product or service so I just call'em like I see'em, nothing more, nothing less. This is a "not for everyone broker" but will serve quite well for those traders/investors who like to look after their own.

Jeff.

Thursday, January 22, 2009

The death of the fake trade...for the most part.

OK,

This non-trading has got to stop and the only way is for me to concentrate on the task of trading. I felt yesterday some sense of frustration at not being able to be on the ball for trading and at the same time a sense of peace that I knew for certain that I could not lose any money...not trading...while still getting to call the trades.

I modified the charts before saving yesterdays activity for posting here...suffice it to say that the price bounced within pennies of the pivot points for the morning and there were 40 cents per share in TLM of nice clean trading, two trades. HED was spotty and I might have traded some but it is a non issue.

Everytime I review the charts I see the perfect setups that could be used for trading just using firm pivot point entry and exit rules. I fake some of them and just chart others. The odds are stacked heavily in my favour for just trading based on those alone.

More on that after todays real trading.

Jeff.

Wednesday, January 21, 2009

January 20th, late update.

Here are Tuesday's charts with notes. The price plummeted below my pivot points altogether so in keeping with my rules I would not have entered a trade at the bottom as I had no reference as to where the bottom may stop. I could have traded it and just went with the quotes and sentiment and done well enough but for historical checking that is too subjective a trade decision to be able to say "would have". So trades would not have been entered until the PPs were back in play as indicated on the charts


Four trades for 45 cents per share gain.

HED, on the other hand, started well within the realm of the pivot points which made it a good early trade entry. In fact I had this one on my order box before I got called for another issue that required attention.

R1 was at $18.58. My order was set for $18.55...Due to the interruption I did not hit the "BUY" button. The price, I saw afterwards, dropped to $18.50...so I might have even got a better price than my order. Normally I would target the next PP being R2 but the price was cleanly shooting up as the market was dropping. Holding right up to almost $20 would have been a no brainer as I just used the quotes and sentiment and exited when things cooled down.

I would have finished trading after the one trade as it would have been a nice $1.40 move.

Jeff.

Monday, January 19, 2009

January 19th playing around

I will not trade on American holidays as the volume on the Canadian exchange is pretty low. I did drop in to see what I might have been able to do but with spreads of 10 cents and over I will not trade. At one point the quotes were Bid: 11.93, 11.88, 11.63, 11.50...basically no support. One of my fake trades took advantage of the lack of support as a signal to exit while there were still bids in my profit zone.

I ran 3 fake trades and showed a portfolio gain of 2.4%. I am pretty sure that I played them accurate enough to have actually made these trades.

Due to the drop in energy stocks overall the best trade was HED, Energy Bear ETF for a neat 32 cent gain. The spreads were even larger on this. With normal volume I could have easily seen between 10 and 20 cents more for the trade assuming that the inside ask reached the same level.

All in all it was an interesting hour, I learned that I could trade these if I wanted to...but will still likely choose to sit them out.

Jeff.

Friday, January 16, 2009

January 16th, Friday

Normally I stay away from trading on Fridays, along with a few other holiday related days, so I only watched some key times to see what was happening. I would like to take a look at three of my charts anyway to check out the PP200 possibilities that occurred.

Talisman Energy first.


The premarket action looked like a similar setup as yesterday, likely headed down after a gap up. With this kind of gap I would expect a gap fade strategy to work well...if I could short. The first trade would not be a sure thing as it is only on the halfway point between PP and R1. Two and three are specifically using 200sma and end up being very small as the 1/2R1 acts as resistance. Fourth is right off the PP but again a small trade. All told there might have been 45 cents altogether here, 300 share trades assuming commissions and no other losses would yield $105...making every trade and exiting well.

Suncor

The first possible trades were only playing with the 1/2R1 so they were not solid PP200 trade setups...but could have been traded given the rest of the indicators being in good shape...but they weren't as I checked a few times. After 1130h was the key time here as the price came down to meet the 200sma and it acted as support. The following four trades were solid and could have garnered $1.15 per share...200 shares less commissions for $190. The fifth trade would have been the kicker for a good 70 cent run.

I really need to get comfortable with this ETF as I am only playing long, as I have mentioned many times. The chart after the fact looks really spotty as the price appears to jump around. This is the uncertainty factor on these. The quotes show another story though as they smoothly slide from price to price and I think I could nail some of them in between the gaps. It looked like three decent trades but this is even farther out specualation than I have been doing on other charts.

Jeff.

Thursday, January 15, 2009

January 15th, recap

Famous last words, "Knowing when to walk away. ", I pulled that from earlier. I think that I walked away at about 1230h. OK, so walking away at that point was not necessarily the best timing. I had appointments for the kids and other work stuff to complete so it wasn't like I chose to...although I am aiming to not be trading in the afternoon.

In hindsight I see that there were half a dozen decent long trades. I was telling myself to watch the 200sma as I waited out the morning, I expected a turn at that time. I wasn't wrong but I couldn't take advantage of it. This is the point of PP200 as the price makes that crossing it serves to set the trading bias for the rest of the day. It is nice when the price opens and doesn't move quite as fast as it did this day. Ths 200sma is more influential earlier on those days.

My target is to trade 4 days of 40 weeks in a year, so missing a few days here and there is no big deal at all. I am not concerned or worried...a little miffed that I could not show a profit immediately but, on the other hand, I also show no loss. My strategy has kept me away form the poor trades during those times when I was watching the market.

This proves that particular part of my plan works as it should, loss avoidance is better than loss allowance.

Jeff.

January 15th update

What a day. Two days into the active trading plan and I am stuck again. 1030h and all the stock has done is drop. Boy, do I miss the short selling. I watched as the price of TLM dropped off the bell about 15 cents, jumped back up and has headed down ever since. That would have been a short that I would have taken as the PP and the 200sma were both acting as superb resistance and the quotes were also indicating a selling pressure. I think that I would have rode it right down to $11.35 (from $11.90) as none of the rallies were more than 10 cents...about my general mental stop setting for TLM.

HED, the bear ETF, would head up as a result and looked good for that as well. I am stuck on trying to get some long positions in TLM so I do not pay as close attention to HED. That and it tends to gap a lot. I have a few places where it has jumped 20 cents. Now, with a judicious use of limits I could get in and out of even those, perhaps, but as I said yesterday, I am not familiar enough with these to start jumping in and out of them like a stock yet. Too bad as I missed out on a good $1.00 move already.

Shame.

I heard that there was some bad news for oil sands projects, Apple has CEO issues and Nortel filing for bankruptcy protection...these are all likely a factor and it is reflected in the market. This is why I don't bother much trading on news as the news shows up. I did not know of the news, other than Nortel, until after seeing the results in the prices and indices.

So it looks like I will be sitting on my cash for a while longer. I think it is time to do another scan for stocks to choose from, or perhaps check out some other higher volume ETFs to play off of.

Oh, no charts, just drawa straight line fromthe top left of a page to the bottom right and that is about what it looked like...revesre it for HED. I will keep an eye on it to see if anything materializes but it doesn't feel very good to me.

Knowing when to walk away.

Jeff.

Day one...or not.

Yesterday was to be the first real planned trading day with my TFSA account as I saw Tuesday night that it had been linked to my platform and all my funding is in place.

Big plans.

I do work for a living but have very flexible hours when I need to. So in the interest of concentrating on trading I had planned on heading home at 0900h...it's a ten minute drive...and that would give me time enough to setup my computers and do some other at home things before the market opened.

I had one fellow call in sick, so I had to juggle the day...then I had another call in with car troubles (-26C)...more juggling. At that point I decided that I was not meant to trade today...but I persisted and left on time only to be stymied by the markets.

TLM yesterday, the pivot points are today's setup so they do not apply.


There was one decent trade early on as the SPTEN (and TLM) dropped and HED climbed. I am not comfortable with the ETF trading yet so I let it go to watch only for long positions with TLM. There were quite a few PP200 setups that looked promising on the chart around the 1000h mark but the quotes were telling another story. They were screaming "DON"T MAKE THE TRADE" for a solid 30 minutes as the price seemed perched on a launching pad and bumping along what looked like a good resistance level...only to fall through it again.

I shut down and went back to work after having placed no trades.

Long trades could have been entered at a few places but none really followed PP200...until after the 200sma caught up with the price. There were three trades after that, but of course I am not usually trading the afternoon.

Interesting note about the quotes. I am using only level 1 so I cannot tell who is placing the bids or asks only how many are at a particular price. Normally when there is a very high bid volume at a particular price just below the trading price it can indicate strong buying pressure. Then, as the price gets a little lower the bids break out and start climbing and the asks start moving away and the the bids follow. The trick is to watch the bids under this high volume bid. If there is no real depth then there is no support for the price.

Today the high volume bid did not budge. It ranged from 150 to 300 shares at any given moment, some trades broke ranks and edged the price higher but as the price started trading at the bid the price did not rise, it fell through as soon as the bids were exhausted. A false bottom.

Jeff.

Tuesday, January 13, 2009

Speculation about today and PP200

I checked in at the end of the day to see what kind of action the market had and specifically TLM. I quickly plotted the trades that could have been taken based solely on catching the price at or within 2 cents of the pivot point line.


Without getting into each trade the total captured price move over the day would be $1.46 ps(12.2% on the trade)...over 300 shares trade that is a decent $438 (10.9% on the portfolio).

Now, for these I usually apply a fudge factor to account for slippage, early exits and whatnot. IF every trade was made I would use 70%. That's $1.02 ps (8.5%), $306 overall (7.6%).

Here is where the 200 part of the PP comes into play. On all of the trades the 200 sma was as far as the next or last pivot point or half PP line. The one exception is the red circled possible trade as the 200 is right above the nearest 1/2PP line...too close to be considered a target althoughthe first trade might have managed to squeeze 4 or 5 cents profit it is not a good setup for a trade.

This is where I will miss my short sells as there was another $1 movement that I could be short selling based on PP200 as well...perhaps I would only get 70 cents of it but on a down day the returns would be reversed.

Jeff.

January 13th, final tweaking

Still no account setup yet so another day of fake trading. Yesterday was a learning experience due to the short range, today was one just due to the mediocre range. Market is still under 9000 so still uncertain. It needs to either head down or up before there will be much large volatility again...but that is fine, perhaps I will start trading cash when the market picks up it's heels and I can start on a good day.

No matter.

TLM chart for the morning. I added dashed lines to represent the mid range of the pivot points, specifically the ones that are off the chart so this gives and idea of where they will be AND provide another possible zone of resistance and support. I have known that these can be as relevent as the PPs themselves sometimes, in their own way, I just didn't plot them or really use them.


I did a bit of swing style trading as the price moved up, I could have just held the first trade but I wanted to see some profits after yesterday's poor performance. The bluse circles are trades that I considered but waffled on so missed the entries...I refuse to chase a price as it is quite likely to retest the entry price level before moved the way I anticiapte it...that just puts me behind more should I be wrong. This has proven to be a very useful strategy by keeping me out of some losing trades altogether and letting me exit gracefully and without fear.

Buy $12.00 Sell $12.18 Gain 18 cents ps Return 1.5%
Buy $12.12 Sell $12.25 Gain 13 cents ps Return 1.1%
Buy $12.27 Sell $12.27 Gain 0 cents ps Return 0%
Buy $12.16 Sell $12.23 Gain 7 cents ps Return 0.3%

$0.38 gain per share or 2.9% overall return on trades

HED privided one decent trade. I kept plugging away at TLM until the SPTEN looked like it was going to give out for a bit...chart at the bottom.


I entered earlier...or later than I ought to have. I would not have go in on the early trade as I was just exiting TLM so waiting for the better setup would have been more prudent. I think I should have exited this trade at S2 in order to have folowed some of my plan. I held through and let it ride up to S1 though and madea decent gain.

Buy $17.25 Sell $17.65 Gain 40 cents ps Return 2.3%

$0.40 gain per share or 2.3% overall return on trade

The following SPTEN chart shows the ideal timing for HED in blue and the actual timing in red circles. This shows the inverse correlation between the S1 and S3 on HED with the PP and R1 on SPTEN. Had I had the dashed halfway point between PP and R1 it would have been clean support and would have corresponded with S2 from the HED chart. I marked the relationship between SPTEN PP and HED S1 as the prices crossed them at about 0945. This led to the assumption of other correlations and makes it easier to follow the concurrent charts.

Total tally was $144 net for a portfolio return of 3.6%.

Monday, January 12, 2009

January 12th...I knew I could do it.

I am still waiting for my account linking to take place so I decided to do some fake trading. All of the historical days I have been doing of late all look sunshine and rosey, as hindsight studies should. So I thought I would put some of my theories to the next test.

The almost real fake trade.

What I managed to do was to show a miserable loss while faking. This was a very crappy day to be trading though, so I think I will blame that, primarily, and the fact that I did not recognise it until after 5 trades is the secondary issue. At least I was faking.

No need for better resolution on this chart. The price opened well below the S1, headed for S2 and just plain wallowed in misery right up to noon. The entire range from open has been less than 30 cents. I will not go on about these trades as the green S2 was the trigger for entries and the exits were just whenever I was uncomfortable with the lack of movement...which was often.

HED has been 60 cents and has been elusive to catch the right swing as there is mostly flailing.

I faked ten trades and the results are as follows:

TLM, 6 trades, +8 cents per share, 300 shares = $24 less $60 commissions. (-$36)

HED, 4 trades, +14 cents per share, 200 shares = $28 less $40 commissions. (-$12)

Great grand total of (-$48) net.

I was down about $100 net after five trades and almost threw in the towel but decided I should keep going for the sake of experience at this point. So commissions were the difference between an on target day (1.3% overall) and the resulting loss (-1.2% overall).

I figure that fake trading a day like this is a great setup for trading a good trending or larger ranging day as I was able to squeak some winning trades in in such a tight range. Largest winner was 14 ents per share and the largest loser was 10 cents per share.

The market (TSX) opened and has remained under 9000 and I believe this is the issue as traders and investors cannot decide what to do. This may be a the beginning of a new drop in the market as a whole as it is trending down, if you can call this a trend today, but is bumping against the 8825 mark as support. I'm not into market prognostications though.

I guess I am going to call this a consolidation day. I do expect a surge one way or the other starting at mid afternoon though. I am not looking forward to tomorrows tight pivot points as that will make using the PP200 strategy difficult.

No matter, I am done even faking trade for today. I am hoping that tomorrow is a larger range day.

I just noticed that my account is reflecting only the cash amount as buying power. I must lose my margin capability at some point. I transferred all but a few hundred dollars to the TFSA in order to leave this account active and use it to cover the data fees, should there be any, so the fees are not withdrawn from the TFSA.

Jeff.


Sunday, January 11, 2009

Trade sizes

I will probably only start with $4000 in the TFSA due to the prices of the stocks right now. Having an extra $1K in the account does not increase my position size possible for any of them. At the point where it will make a difference I may consider adding it later. If I am trading well then it would be worth the investment...but then again, if I am trading well, why bother as it will get there on it's own anyway. I would rather let these trades grow as the account grows rather than getting in too deep too fast anyway. I always thought it would be nice to drop $50K into an account and make more money but that would just increase the pressure and change the dynamic of the trade enough that it might be detrimental.

HED is around $17, 200 shares
TLM is around $13, 300 shares
SU is around $28, 100 shares

Jeff.

January 9th...more could have's

Well, I am nearing the end of the speculative chart work now. So this may be the last one...perhaps one live one for Monday if my account doesn't get linked to my platform until sometime on Monday.

So let's take a quick look at Friday. I set the pivot points up as usual:
Dark blue is the previous close, Light blue is the primary pivot point,

Green are S1-3, Red are R1-3
Averages - Red 30sma, Blue 50 sma, Green 200sma

Green arrows are buy and red arrows are sells

Capped Energy chart


The move off the start is a rather steep selloff and would indicate some good shorting opportunities and I would jump over to HED to take advantage of those, but first let's look at the TLM chart.

Activity here didn't start until late into the morning as the p;rice bounced off of the S1. I don't mind holding this one through some pullbacks as the price difference is slow and not large, having said that the exit just before 1130h is mainly due to the swings and failure to get any closer to the nearing 200sma. I may have jumped on the previous pullback but it is hard to say without being there live. Second trade is pretty standard but deviates from a pure PP200 a bit. Trade three is right on the money and as the price cleared the 200sma so well it would be worth holding for at least the PP target. Again the price is not that volatile so it is OK to risk holding it through some of these pullbacks.

Buy $12.46 Sell $12.60 Gain 14 cents ps Return 1.1%
Buy $12.50 Sell $12.62 Gain 12 cents ps Return 1%
Buy $12.47 Sell $12.72 Gain 25 cents ps Return 2%

$0.51 gain per share or 3.1% overall return on trades

300 shares traded for $153

Now to HED for the "short" action


Based on the Capped Energy chart this was really the only decent trade as this entry corresponded with Energy falling through it's PP...as the PPs more or less line up with this fund it makes the trades fairly easy. With Energy leading this the trade is worth holding through the small pullbacks.

Buy $16.45 Sell $17.00 Gain 55 cents ps Return 3.3%

$0.55 gain per share or 3.3% overall return on trades

200 shares traded for $110

SU can only be traded for 100 shares per trade so it will not be prime on my list anymore but is worth watching yet at least to keep it in my list for some time when I can trade multiple lots.


Long positions were hard to find on this one. I may not have even made these trades at all if I were only watching SU or I may have tried and lost on a couple of trades before giving up. Only trading 100 shares makes this a tougher one to make any real headway on as the volatility is not that great.

Buy $28.05 Sell $28.40 Gain 35 cents ps Return 1.2%
Buy $27.60 Sell $27.76 Gain 16 cents ps Return 0.6%

$0.51 gain per share or 1.8% overall return on trades

100 shares traded for $51

Jeff.


Friday, January 9, 2009

More Questrade TFTA TFSA updates

I received my passwords today for my new account.

In the interest of be sure that fees are kept to a minimum I went online to try chatting to find out how to do this but no operators were avaiable and I was not going to wait for an email response.

So I picked up the phone and called.

5 mins 35 seconds from start to finish and the CSR had pulled up my account and linked my accounts so I will not have to change passwords or use two instances of the trading platform. I should be able to trade Monday...or at least by Tuesday.

I have heard others gripe about their customer service but I have yet to experience any real problem or hassle. My expectations are not that high, I will admit, but I pretty much get what I expect...and then some in most cases.

All in all, very helpful and in good time too.

Jeff.

TFTA, TFSA and Questrade

I applied for and have my new TFTA account and I am now just waiting for a password to start trading.

The process went smoothly except I tried faxing in my photo ID and it was too dark, I should have scanned and emailed it so I have about a two day delay that I caused.

I was able to use e-signatures to send everything in without having to mail paperwork, used a transfer from my margin trading account to initially fund the account and sent an EFT from my bank account to add some more capital to start with.

The only thing that I have not had cleared up for me is exactly how two trading accounts will work. I am sure that the trading platform handles multiple accounts, the manual states that it does but gives no details. I am sure it is just a tab selection to switch between the two so I am not really concerned about the functionality.

What I am not sure about is how to get the two onto the one platform...or how to switch the platform to TFTA exclusively. I just am trying not to incur any additional data fees or at least keep any potential data fees outside of the TFTA.

Having said that, my plan is to do no margin trading so I could just transfer the whole works. Being a discount broker I did not want to get too complicated with my setup so I will wait and see how it meshs...I have an email in to have this questions answered but I don't expect a quick answer. Right now they are up to their eyeballs in people inquiring about TFSA stuff. I see that their online help, which is usually very timely, is now running 20 people deep and 30 minutes or more behind the estimated handling time.

Don't be in a hurry if you are looking for answers from Questrade right now. Perhaps they underestimated the flurry of applications and questions that go with that.

The end run is that I expect that once I have my password and access to the TFTA I will have to call and have a CSR do some keypunching to get me set up the way that I want. I registered the account under the free platform package for now...I should have suspended my Pro package for January but I would have had to register the request in December and I would have lost my realtime feed to do any more testing... I need my feed.

All in all we shall see how this goes.

Jeff.

January 8th

Some post market strategy checking.

I plotted four trades in the morning based solely on the PP200 plan. The first trade was pretty early and almost more an impulse trade than a PP200. Without seeing the premarket quotes and watching them at the open it is hard to know for sure that this was a good trade entry but a price dive to very close to the S1 and a quick return like this would be well indicated, getting in in a timely manner would be the only real issue. The 200 was broken above the S1 so I might have figured up, I am not spending too much time on this now though so I will just follow the pivot points and price action. There was another good entry just after 1030h but in the spirit of the plan I only added teh trade after waiting for the 1100h bouncing on the previous close.

Buy $12.32 Sell $12.69 Gain 37 cents ps Return 3%
Buy $12.56 Sell $12.70 Gain 16 cents ps Return 1.3%
Buy $12.70 Sell $12.76 Gain 06 cents ps Return 0.5%
Buy $12.71 Sell $12.91 Gain 20 cents ps Return 1.6%

$0.79 gain per share or 6.4% overall return on trades.

The first trade value would be bang on $5000 for 400 shares so I might have used this as incentive to make that first trade, risking an earlier trade to take advantage of an additional 100 share position size. This would also allow me to play the rest at 400 shares due to the profit off the first trade.

At 400 shares that would be $264. Should I not make the first trade then the rest would be 300 share trades and the profit would have been 42 cents per share for $126

Both figures are well past my target so I would not begrudge missing the first trade....but let's look at SU and HED anyway, just for kicks.


The first trade is setup and bounces pretty early off of S1. Dark blue is previous close and open acts a strong as a pivot point so I would have considered the first little peak an exit point and would not regret missing the next move up as a result.The second trade is a bit more complicated as it starts to incorporate the 200sma into the mix. Rally off the entry is good, the pullback is more than I might normally let go but the price is over the 200sma and returns to test it momentarily without breaking down...maybe a little risky but a solid probable hold. Given that it played out once the next pullback tests the close price, twice, then heads up over PP. I let it ride enough times and would jump here as my target was met nicely.

An aggresive trade move here could include scaling out, selling half and letting half ride or really aggressive would be to hold as long as the red 30sma line holds. Either would have had me holding past R1 for a full exit with 60 cents ps extra, but I am not greedy even in historical testing.

Buy $26.57 Sell $27.04 Gain 47 cents ps Return 1.8%
Buy $26.77 Sell $27.80 Gain 1.03 cents ps Return 3.8%

$1.50 gain per share or 5.6% overall return on trades.

At 100 shares that would be $150. I could not trade more than 100 shares as even 200 puts the trade size at over $5K. This is why a smaller priced stock can be much better to trade right now. Having said that I do not want to go too far with this just yet as more than 400 or so share trades may execute differently and the losses are also larger by the same scale.

Actually, I changed my mind. The Energy index did not drop enough anywhere to make trying to play HED a good enough idea. There were a couple of potentials in the afternoon but I won't bother with the charts for those. I wouldn't have traded them as I was already in good shape from the morning and I don't trade in the PM yet and there were still some decent long trades on stocks left int he market anyway.

Jeff.


Wednesday, January 7, 2009

Overall strategy progress

I chose to not do any trading today, real or fake for a couple of reasons. I did check out and plotted some trade setups on the previous post. Primarily I will not be trading until the tax free account gets setup and I have submitted all of the paper work, the account is setup, cash is in transit and I am waiting on one verification step. Probably next week now.

I wanted to point out to any reading here that this is not a step by step manual to trade, although there are lots of pieces of the puzzle the one piece is experience that cannot be learned. Realizing that some time ago I have just been jotting stuff here as a bit of a trading journal. The blog platform lets me capture trades, ideas and other information in a media that allows some decent sorting and labelling for future reference.

I don't think that I even cover any particular topic well enough for it to be a real guide, perhaps just a teaser to prompt anyone interested to research further if they are interested in anything posted here, or drop me an email or leave a comment.


So on to more me stuff.

I setup spreadsheets to track my progress for fake, real and combined trading and left them separated by month. Normally each time I restart the starting balance at $5000 for each month so I do not really have a general overall cumulative idea of where I would be other than each month has been profitable and by how much. I do not want to start playing as if i have more money than I have, keep it small. I am not changing my spreadsheet plan quite yet, although I will be tracking my portfolio balance in future and I do not plan any more fake trading other than to try a new twist on an idea.

I restarted a December spreadsheet on the 19th figuring that I would be able to concentrate more on the trading over the holidays as I was taking the week off of work.

Stats:

startup capital = $5,000
days traded = 8
trades executed = 33
Balance today = $6217
Return = 24.34%
Lowest day = $53
Highest day = $366 (yesterday)

Eight days is the equivalent of two weeks trading four days a week, as is my goal. Being really optimistic and extrapolating these numbers for tha 40 week trading year (for me) is a simple return of 486.8% for the year...that's $24,340 tax free profit. Cool.

So if I have three 10% drawdowns over the course of the next three or four months, just pulling numbers out of the air here, I re-ran the spreadsheets.

There was a 5 week delay in meeting my cash return target based on the testing results, above, and an 11 week delay in my 1% per day target forecast.

I will be sizing my positions based on the account balance. A stock that trades at $25 I could trade 200 shares but a stock that trades at $26 I could only trade 100 shares (capital/price = position) and the position must be even lots of 100. So I have chosen a small range of stocks and equivalents ranging from mid $20's to just over $10. As my portfolio increases so to does my capability to trade larger positions and/or larger priced stocks.

Smaller priced stocks also allow the compounding effect to be accelerated as I can increase position size with smaller increments of cash. Over the next year that will add up quickly, as compounding does.

Jeff.

January 7th, "could have's"

I did not trade or even look at the market today but I decided to see what it could have had in store for me. Sticking to my PP200 strategy, which is pretty much just using pivot points for entry determination and the 200sma relativity for bias and sprinkling in a little market timing for the exits, I plotted out the most likely trades of the day.

Both Suncor and Talisman had down days and that is the bias for the day based on the price starting out the way that it did. Watching for the support to appear at the primary pivot point the entry occurs upon the PP test as the price heads back up. Exit is pretty standard as the price gets near the R1 and a classic candle pattern looks like a peak. If this had been in the middle of a range I might let it go. Perhaps a 40 cent trade for 100.

Talisman didn't pass the PP so just entry right off the bounce...either the second or third minute following the test. Exit is a classic volume depletion. About 20 cents.

Both of these trades are against what would be expected for the day but at this point the actual trend is not really established, so I would be trading the opportunities. There appears to be another long trade just after 1030h except that the next pivot point, S1, is much lower so it would not have followed the PP200 strategy. If I chose to stray I might have entered this one on the second dip and may have seen a 30 cent gain...a lot would depend on the setup at the time though. SU had a very similar opportunity but again, without being there ...

Now, the Capped Energy index is basically the exact same pattern and is the "control" for trading these stocks...see the fourth chart for the HED bear ETF.


This is where the money was today. Considering that I expected a down day I would have my eye on this one more so than the others. Considering that I can only trade one stock at a time as I am going "all in" for each trade I do have to make some decisions about where to focus. I am more comfortable with the stocks at the very beginning and they bounced nicely so one of those would have been the primary trade. Then, shortly after 1000h the slump starts so shift to HED in anticipation of the trend setting.

After trading SU or TLM the second trade on this chart is the first real candidate. Second test of the S1, maybe a slow entry. The little hesitation midway to the PP corresponds with the SPTEN index testing it's PP... given the bias I would hold that through as there is not much of a pullback on HED. It then screams up past PP as SPTEN drops like a rock. 85 cent gain.

The wrap up:

This trade takes me to about 1045h so I would stop having met my goal for the day and it being near my time cutoff. If I had to choose between SU with it's larger swings or TLM and it's larger position sizing I think I would tend toward TLM. SU's trade was 40 cents ps at 100 shares for $40 based on $5K capital but TLM allows 300 shares. So a 20 cent ps trade profits $60. It goes back and forth as to which is better on any given day with this ratio so I am probably best to just pick one and go with it. TLM is close to being able to trade 400 shares so It would be my focus soon anyway.

HED also allows 300 shares traded so an 85 cent gain is $255...nice. If I traded the rest of the day and followed PP200 there is another 50 cents overall as the price of HED bounces along the 200sma...kind of the norm for afternoon trading so i eventually want to be able to take advantage of some of these long rides. I just plain do not have the time right now and I don't think I want to play with VTSOs jsut yet.

I don't go on much about losers as I have about 5 losers for the last 30+ trades and they are for pennies a share...so extrapolating that here might reduce the possible overall gain by say $20. Even if it was $100 I would still have met my goal but I would not allow a $100 drawdown ... anymore.

I have to keep in mind that my goal per day is 1% return on portfolio... $50 right now so all these larger numbers are almost pure gravy, like today's $315 or yesterdays live trading at $366. I like to keep myself grounded so I do not get carried away when the money is on the table. I also do not want to slack if I do have such nice days as I do not want to get lazy or over-confident and lose my edge.

I will probably post a wrap up for the last round of trade testing later. It looks better than any of the previous tests even though I was hard on myself.

Jeff.

January 6th trading plan, PP200

Yesterday's plan was to use the new idea of the Pivot Points as entry and exit and the 200sma as a genreal bias indicator...although I could not trade for the whole day it turned out that most of the good moves were in the monring anyway and I was done by 1030h.

So here are the charts for the trades of the day, Suncor with two trades.


Buy $28.60 Sell $29.40 Gain 1 dollar ps Return 3.5%
Buy $29.63 Sell $29.60 Gain (-3) cents ps Return (-0.01)%

$0.97 gain per share or 3.3% overall return on trades

First is a bounce off of the R1 for a early entry. I may have considered selling as the price hovered just below R2 but these were live trades, not historical speculation and I decided to hold it through and was rewarded by another 25 cent move. The second trade was placed as the price bounced off of R2 but was exited at 100oh due to weakness in the overall market as seen by the decline in price on the following Capped Energy index.


This index chart gives me my signals for trade exits and worked well yesterday. I will be following this index even more closely now as the last two trades of the day were on HED, the Energy bear ETF, chart follows:


Buy $14.31 Sell $14.64 Gain 33 cents ps Return 2.3%
Buy $14.65 Sell $14.85 Gain 20 cents ps Return 1.4%

$0.53 gain per share or 3.7% overall return on trades

The strong inverse correlation between the Capped energy and the HED ETF make for a nice combination as the index tends to lead the ETF by enough time to make the trades and enough time to place a good exit. The only factor is that the quotes tend to move ahead of the actual price more so than a regular stock, partly due to the low volume and difference method used for valuation. This one could be a decent vehicle to perform some true scalping...but I don't know how the low volume would affect such a strategy.

The Energy index dropped through R1 nicely, and would have been a great short sell trade on SU if I could short. Instead I look at the HED and see the corresponding gain in price. Using the PP200 plan I would not enter until R1 was broken on the way down which equates to S1 broken on the way up on HED for about about a 20 cent gain (conservative). Enter at 1055h exit at 1110h as the index stalls but the ETF doesn't drop off as quick.

Realistically I would have placed a more aggressive position trade at 1050h and exited at the same point for a gain of 38 cents. Both of these are just "could haves" though so I don;t count them as anything but a bit of chartwork.

Jeff.

Tuesday, January 6, 2009

Crude Oil, HOU and HOD ETFs

Someone asked me about investing in oil the other day. I am not going to be doing so but I do watch other charts and markets seeing as I have to buy gas and it affects almost every facet of life somehow. So one method of offsetting the additional costs of oil induced increases is to own oil stocks that pay when the oil price is high. Dividends are nice but not necessary...in my view.

So, this brings me around to another of the Exchange Traded Funds (ETF).

The short story is that these funds track the sector, or commodity they are named for.

Horizons BetaPro NYMEX Crude Oil Bull Plus ETF... or HOU.TO.


This is a fairly new fund so the 200sma is just getting going, les thana year old. I circled the nicest positive divergence you could ask for. The price is levelling out and the MACD has been steadily rising since October. Personally I would give this one another chance for a pullback before buying in but if a little risk is in the books then it could be purchased now too. Perhaps scale into the investment.

The nice thing about this is there is little fear of the underlying company doing anything weird (Enron anyone?) as there is no underlying company.

Here is a zoom in of the main activity lately...

It looks to me like $10 is about as low as it can go...but that certainly is not a guarantee. Once the red 30sma crosses the blue 50sma I would consider it back in the bullish territory...by then the price could be back up to $20 quite easily. The trick is whether it will stay up or not. As a position trader I would not wait quite that long anyway...one more low to see where the support really is then it would be time to read the chart again. Anything under $10 would be worth the risk for a small position.

This brings back memories of the CTP strategy.

As I will be day trading my full account I don't even have room to sneak 100 shares of this ETF or I just might...although if it drops to $10 even, again, it would certainly be doable, I'd make it work for that.

Here is the inverse ETF, Horizons BetaPro NYMEX Crude Oil Bear Plus ETF... or HOD.TO

This is for those who want to play against oil climbing.

Jeff.

Monday, January 5, 2009

ETF's HED and the Capped Energy Index

Here is a sample of a down day and what an ETF trading might be able to do in place of short selling the regular stocks.

December 22nd, 2008.
SPT/TSX Capped Energy
Dark blue is the previous day close
Light blue is the Primary Pivot point
Green are the S1, S2 and S3

Yup, definitely a down day as the index lost close to 6%. The S1-3 did not mean a whole lot here but there were some bits of support as the price fell and some definite resistance around the $199 mark.

Suncor for the same day

Support fell in some key points and would have been nice setups for some short selling. Too bad I was not watching for these that day. I did trade it and had five trades 3 long fighting the trend and two short. 65 cents gained long (I captured the first big move from $24.40 to $24.90) and only 52 cents gained short as I did not watch the market at all after the first long trades, I got busy with other stuff and came in later in the afternoon when everything had already done most of the dropping.

HED, Horizons BetaPro S&P/TSX Capped Energy Bear Plus ETF, same day

Buy $21.33 Sell $21.64 Gain 31 cents ps Return 1.5%
Buy $21.91 Sell $22.27 Gain 36 cents ps Return 1.6%
Buy $22.61 Sell $23.01 Gain 40 cents ps Return 1.8%
Buy $23.11 Sell $23.31 Gain 20 cents ps Return 0.9%

$1.27 gain per share or 5.8% overall return on trades

This would fall under my multiple lot position sizing as well.
I need to actually make some ETF trades to know how they will behave. The volume is a little low bit the price is more dependant upon the underlying index than the bids and asks. It can indicate a sentiment but not a definite directional move. One thing that I noted today while watching a few ETFs is that the quote spread can be substantial. They just don't feel the same as a stock. It might be partly due to the reverse movement as well as the non-stock quotes.

I think this will be a reasonable substitute for short selling, though it may only be used on those definite downtrend days as I don't think it a great vehicle to attempt to use for those quick drops in price that I might normally try a short while in between long trades.

Jeff.

Pivot points and the 200sma

When I first started trading I tried to set up semi-mechanical systems with limited success. I liked the idea of having the indicators make the decisions to buy and sell for me, mostly. The trouble was I did not trust it as well as perhaps I should have, I was new. I do not believe that mechanical systems are a great idea but they can work. One of the key factors is that they have to change according to the market, as any plan must.

So this is as close to mechanical as I am likely to get as I notice some correlation between the pivot points and the 200 sma line in my charts that perhaps can help to set the trade bias for the short term and perhaps even be used for some lazy trading.

Actually, this is not so much for lazy trading as it might be to let me track a few stocks at the same time. This comes back to the fact that I cannot use short sells in my trading and I will therefore need to watch more charts in order to be able to keep money active while things are turning down.

Pivot points and the 200sma are not so much points or lines as they are zones of support and resistance. In this sense they are areas to watch for activity that may indicate a good time to enter or exit a stock based on other indicators such as the quotes, volume, time and sales and correlating indices.

Here are two charts for today, the first fo SU and the second for TLM.
Blue is the previous day close
Red are the R1, R2, R3
Green arrows are buy points and red are sell points
Green line is the 200 simple moving average


For SU the primary pivot point is below the chart.

The mechanical idea here is that the pivot points and closing price will act as triggers for opening a trade long. Closing the trade is given more leeway but these points will also play into this as well. I did watch these this morning and know that the trades as indicated were definitely possible and would look just like they do on the charts, nice clean setups. A few of them I tracked but most I did not watch that closely.

Buy $26.60 Sell $27.40 Gain 80 cents ps Return 3%
Buy $27.40 Sell $28.00 Gain 60 cents ps Return 2.2%
Buy $27.75 Sell $28.10 Gain 35 cents ps Return 1.3%
Buy $27.80 Sell $28.10 Gain 30 cents ps Return 1%

$2.05 gain per share or 7.5% overall return on trades

Here is where the 200sma relationship keeps the trades capped. As the price drops below 200 the best next trades would be short, but I cannot trade short sells so this just keeps me out of the action here which is where the ETF comes in, but that is another story.

TLM followed a very similar idea, as it should as it also follows the capped energy index reasonably well, although today was a bit off as I couldn't really rely on the strong sector as an indicator.

Buy $12.90 Sell $13.10 Gain 20 cents ps Return 1.6%
Buy $13.02 Sell $13.22 Gain 22 cents ps Return 1.7%
Buy $13.16 Sell $13.24 Gain 8 cents ps Return 0.6%

50 cents gain per share or 3.8% overall return on trades

Keep in mind that I plan on having a certain dollar amount committed to these trades so SU might be a 100 share position and TLM would be a 300 share position. In those cases the net gains would be $165 and $120 respectively.

It is a shame that short selling will no longer be available to me as there were as many opportunities to short as there were to go long even with the strong rally over the day. I consider the fact that there will be no taxes on any of the profits and that will make up for a large part of this minor restriction.

Jeff.

Sunday, January 4, 2009

Pivot Points and their relevance

I stumbled upon pivot points a while ago quite by accident. It was mentioned in an article and the term intrigued me enough to go looking them up. Now I do not trade without them, real or fake trading. I have found that they make very good targets and I suppose it is not so much that they are predictive, as it would appear by the following chart, but more likely a self fulfilling prophetic tool because many traders are using them.

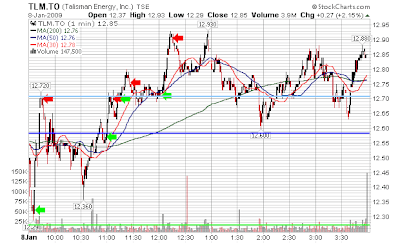
TLM on Friday. The pivot points are represented by the three red lines which are resistance level 1, 2 and 3. The primary pivot point is just below the chart and labelled PP.

Alas, I did no trading on Friday. Busy with holidaying.

I have been plotting these lines on SU, AEM, the gold index and the energy index as well as the TSX or whatever other chart I might be using for trading and reference. TLM seems to follow them even closer than the other stocks, which I found interesting.

The blue circle represents the only questionable period as the price spent a bit of time consolidating before breaking R1. I expect that I might have shorted at about 0945h to try to catch a pullback from R1 to only exit the trade a few minutes later as the price did not successfully break the 10sma. Perhaps the trade would have broke even or a few cents per share profit. Then again I cannot short in the TFTA so this trade is moot.

The price ratcheted upwards towards R1 after testing 10sma a couple of times so this would have made a very nice position entry. This is the kind of setup where scaling out of a trade would come in nicely. R2 would be the target but the price cleanly broke that level and pulled back to test it. Selling half of the position and leaving the rest go would be a good call.

Following just the pivot points and trading long only, there would have been a trade just before noon for about 10 cents per share, one at 1345h for 5 or 6 cents and one last trade shortly after 1400h for about 30 cents per share...but that would involve watching all day.

The whole point is that pivot points are one of the few tools that are not dependant on the price and volume on the day of trading. These lines are calculated easily and are placed at anytime after the previous day's close as they have been determined by the previous day, week and/or month's price movement alone and have been used for quite some time by traders to determine where the trading range may be for a given day. They have proven very useful to me.

I won't get into the formula that I use but it is a standard one that is easily found on a variety of sites online. Setting up a spreadsheet with formulae to calculate these is easy enough as well so you can just enter the open, high, low and close and have the points. The open is not used but I like to reference it. Some trading platforms have these as an automatic tool, which would be really nice but I am not going there any time soon as these are pricey packages that may not even work with my broker feed...so I haven't looked too closely at that yet.

Jeff.

Saturday, January 3, 2009

Exchange Traded Funds (ETF)

Here are four charts that might be examples of what I would be tracking at once.

This first is the Horizons BetsPro S&P/TSX Capped Energy Bear Plus ETF for last Friday afternoon trading. This tracks the TSX capped energy index inversely.


This second chart is the same period for the Bull version of the fund as it tracks the energy index directly. Note that the price is not in the same range.

This is the S&P/ TSX Capped Energy Index itself.


This last chart is Suncor Energy.


The correlation of Suncor and the TSX Energy index is more obvious when looked at in better detail but the pattern is pretty obvious.

The volume of the two ETFs is substantially lower than SU. The volume is not a factor in the ETF's though as they are tracked to the index with some variance due to the bid/ask spread of the ETF. I need to watch these ETFs to see how they behave and it will be different trying to trade a derivative that is not driven by the traders trading it directly.

It is worth noting that ETF's can be traded using all the normal order types available to use with regular stocks, limits, stops, shorts, probably VTSOs and I understand that there are even options on these as well...although I don't anticipate using those.

There are a number available for most of the popular indices, gold, natural gas, oil, financial etc.

Jeff.

Questrade, TFTA, a change of rules, mine

This whole last few months I've been going on about the Tax Free Savings (Trading) Account (TFTA) and how I was going to use it for all of my trading. Yesterday I filled out the application and forwarded it to Questrade. They have a method of e-signing the forms, which may be only available to existing customers, that sped up the whole process. All I have to do is fax them a copy of my driver's license, EFT some cash and I should be ready to go in short order. Pretty simple and quick.

So, in reading the details I ran across the phrase "capital gains" when referring to what can grow tax free within the account. It occurred to me that the profit from short selling stocks is not, technically, capital gains and if push comes to shove with the government they are treated as regular income for tax purposes...again, not capital gains.

I used the online help feature and had my answer in a minute. No, shorting is not allowed in a TFTA. I actually should have known this as I knew that shorting was not allowed in an RRSP account either. I was blinded by the fact that I could short in a margin account and the gains looked really promising...my research was lacking.

I quickly went back over all of my previous trades to see how much of my profit would have been from short selling. This was easy enough as I have always kept a long/short profit ratio for all my tracking spreadsheets. Note that this is not a ratio of number of trades, just profit.

Overall I am running about 1:1. So half of my trading profit would not be counted. Seeing as my performance is close to 2% per day I would be just shy of my daily goal if I dropped half of my trades...or my trading profit. I consider that I usually stop at a daily maximum of 6 trades, more often 4. So if I was concentrating on making that many trades and with long only positions I may have been able to make 75% of the trades. So I might have seen 1.5% per day.

My options to adjust my trading plan include:

1) long only trades with the same plan that I have been using, result may be 25% - 50% reduction in profits

2) long in the TFTA, short in margin, result is taxable (max marginal rate) for all short profits so the overall effect would be pretty close to option 1), within 10%

3) variation of option 2) in that all profits at year end for shorts are contributed to my RRSP account whereby the taxation is negated but the downside is that these will be taxed upon withdrawal... perhaps at a lower tax rate at the time

4) variation of option 1) by using only the TFTA, trading my favourite stocks long and shorting the index that they are tracking through the use of a bear Exchange Traded Fund (ETF), result is the same tax free profit potential as I was planning on originally

Well, option 4 becomes the no brainer solution to my dilemma it would appear. In investigating the ETFs I start to wonder if I can trade them exclusively.

This would be easy enough as I just run the bear and corresponding bull ETF side by side with the related index they track and the TSX for the overall market and trade them back and forth. When one is rallying the other will be pulling back which means that one or the other will always be gaining...except in a true sidways market move. The difference in prices will necessitate using different position sizing for each which will look after the scaling according to the size of the move. Roughly a 1% gain in one will yield a 1% drop in the other.

In the interest of keeping it simple I think I will start out with option 1) only and see how it goes. I believe that the stocks I have selected will be seeing some gains over the next while so long positions will be many, I may have to increase my time trading by a bit though. If that does not pan out then I will play with the ETF and see how they work out for trade executions and perhaps mix it up from there.

I will have to wait for my TFTA to get going first as I really want to stay away from any gains in this 2009 tax year.

I should have known it was not going to be such an easy ride and that the testing was not yet complete. Too bad as I would have liked to have had this ironed out earlier. If I do some testing with the expectation of a loss then it will reduce the capital in my account as I cannot just "top it off" after testing is complete. $5K contributed is the limit no matter the trading losses incurred...unless I over-contribute and pay the monthly penalty. Questrade may enforce the maximum as their policy is worded in such a way at that is possible.

Jeff.